
Returns have been easy...too easy

Key points:
- Over the past 150 sessions, the S&P 500's returns are more than 40x the standard deviation of its daily changes
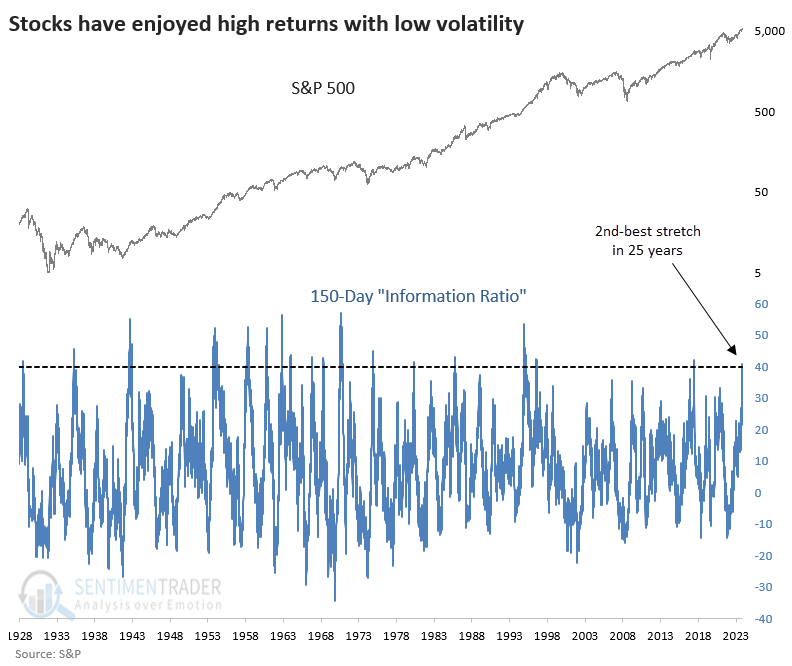
- These "easy money" returns are the 2nd most extreme in 25 years, next to January 2018
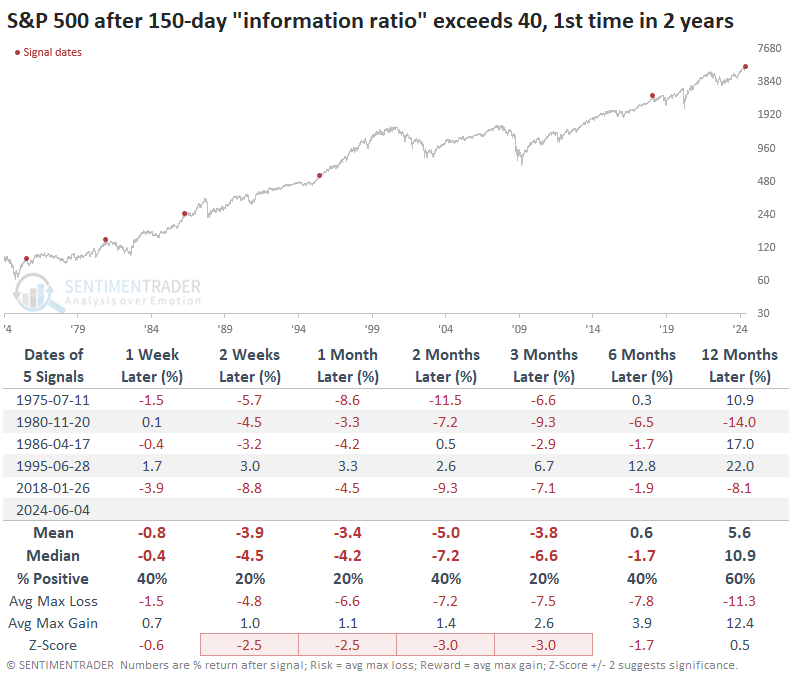
- Over the past 50 years, high returns relative to volatility have mostly preceded losses
Investors haven't had to suffer much volatility for excellent returns
We saw yesterday that investors have had a historically great run since last October. Volatility has been persistently low, and they feel comfortable enough with the state of things that they're judging individual stocks based on their own merits. As they say, it is a market of stocks instead of a stock market.
As a reflection of just how rosy things have been during this stretch, the S&P's "information ratio" has soared to its 2nd-highest level in 25 years. "Information ratio" is in quotes because that's not exactly what we're looking at, but it's close enough to the concept.
We're investigating the index's returns versus the volatility required to enjoy those returns. Over the past 150 sessions, the S&P 500 has returned more than 40 times the standard deviation of its daily changes. The only time in 25 years it reached this extreme was in January 2018.
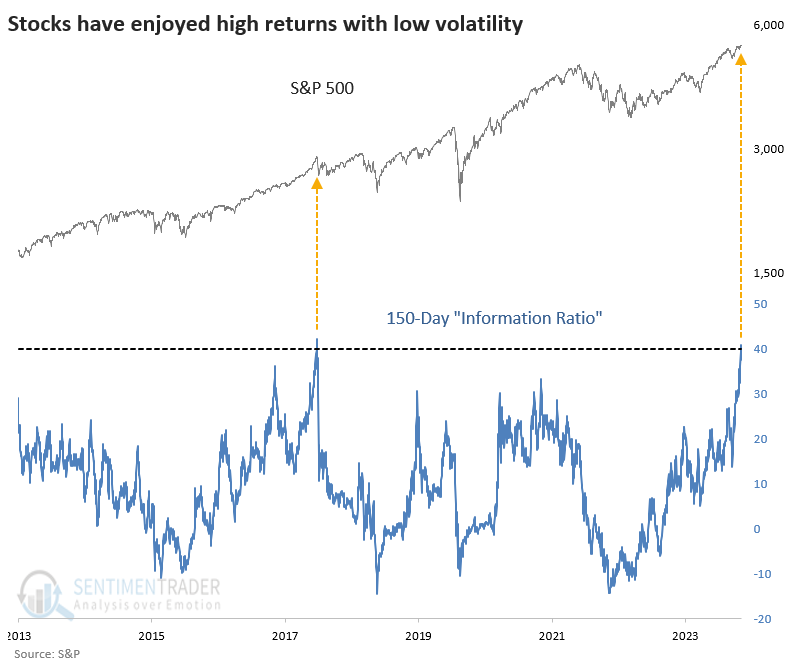
You might remember that markets suffered through "Volmageddon" soon after that when traders piling into easy-money volatility products got smacked in the head. There is a hint of an echo now with the proliferation of volatility-selling funds. There is no free money in markets.
Right now, the information ratio is at one of the highest levels in history. The spike in 2018 was the only similar one in 25 years and did not end well for stocks (for a while). Before the last couple of decades, it was much more common.
A high information ratio led to low returns (lately)
The table below shows whenever the information ratio exceeded 40 for the first time in at least two years. Overall, the returns weren't too bad, especially over the next year when the S&P 500 sported a positive return after all but two signals.
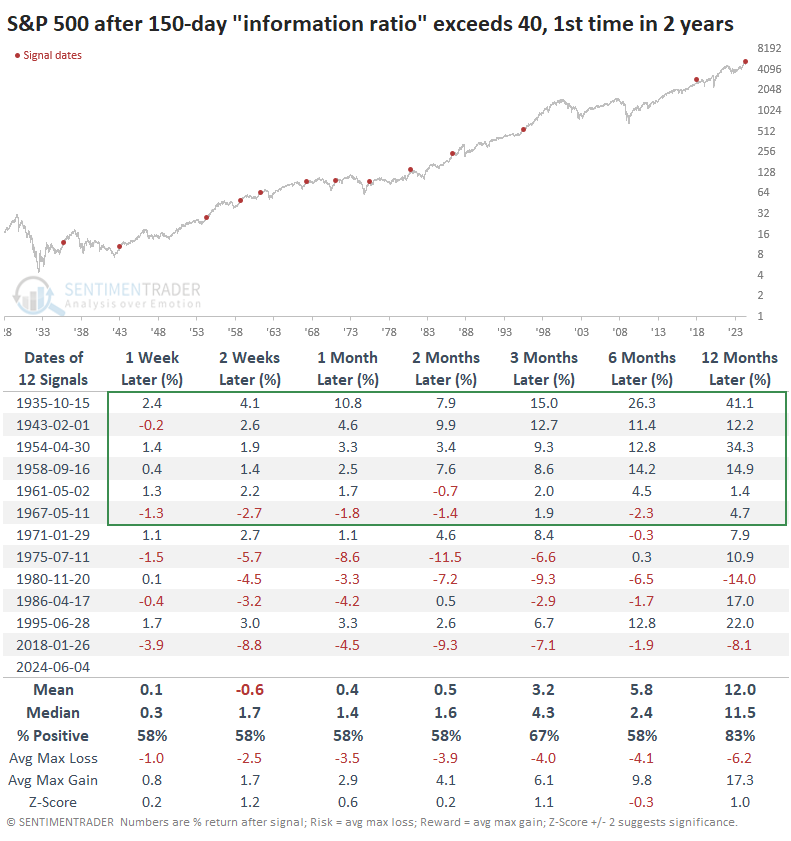
Positive returns in the table above were heavily concentrated in earlier decades. The outlook changes significantly if we filter the table to only include the past 50 years. Up to three months later, the S&P's upside was nonexistent except for 1995, one of the most remarkable "creeper" uptrends in the index's history.
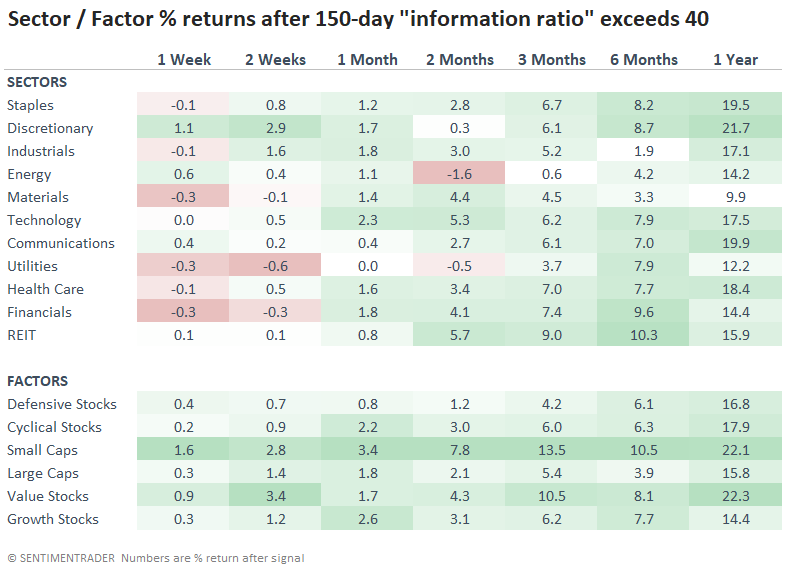
Among sectors and factors, small caps and value stocks stood out for positive returns, while utilities and energy lagged over the next couple of months.
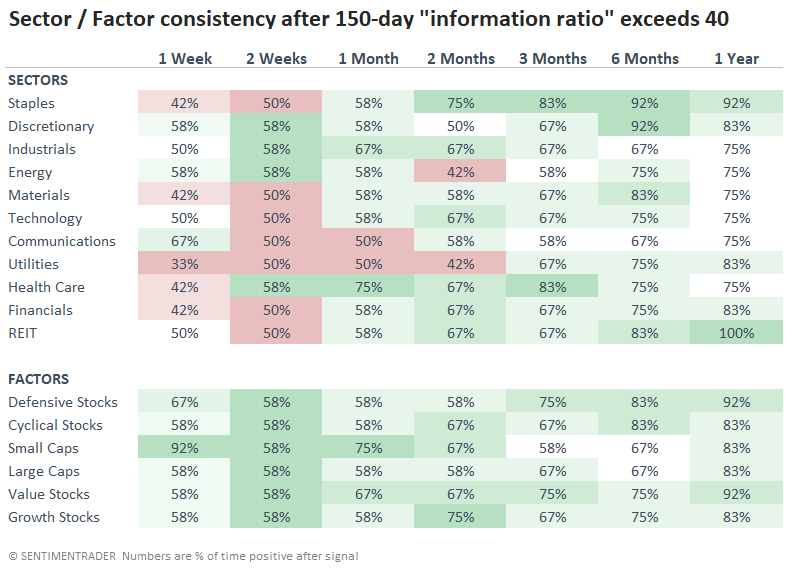
The return table is a bit misleading because of some outlier gains. If we look at the win rate, we can see that small caps were among the less consistent winners over the medium term, while defensive stocks such as staples and health care were among the best bets.
What the research tells us...
You might wonder why 150 days was used. That's a good question, and some data mining is involved, which should always raise a yellow flag. It's approximately the amount of time since the bottom of October 2023. Information ratios using shorter and longer periods aren't as extreme as the 150-day one, which lessens the confidence we should have in any potential conclusion.
Still, positive returns have been very easy to come by for U.S. stock investors over the past six months and counting. Easy returns breed complacency, and complacency breeds volatility. As it always has been, it will always be. The timing of the cycle is a much more difficult problem. We know it will come, just not when, and that's probably the biggest question. All investors can do now is recognize the unique nature of recent returns and consider protecting some of those easy returns.