
Resurgent small caps after years of neglect

Key points:
- Nearly a quarter of small-cap stocks recently hit a new high, while relatively few of the others were in uptrends
- This could be considered a negative divergence but hasn't proven to be so over the past 45 years
- Small caps have underperformed large caps for a record number of years, priming them for mean reversion
A jump in small caps - some of them, anyway
Small-cap stocks finally took a breather on Tuesday after a rabid rebound following the re-election of President Trump, the assumption being that the new administration would adopt a more domestically friendly business environment.
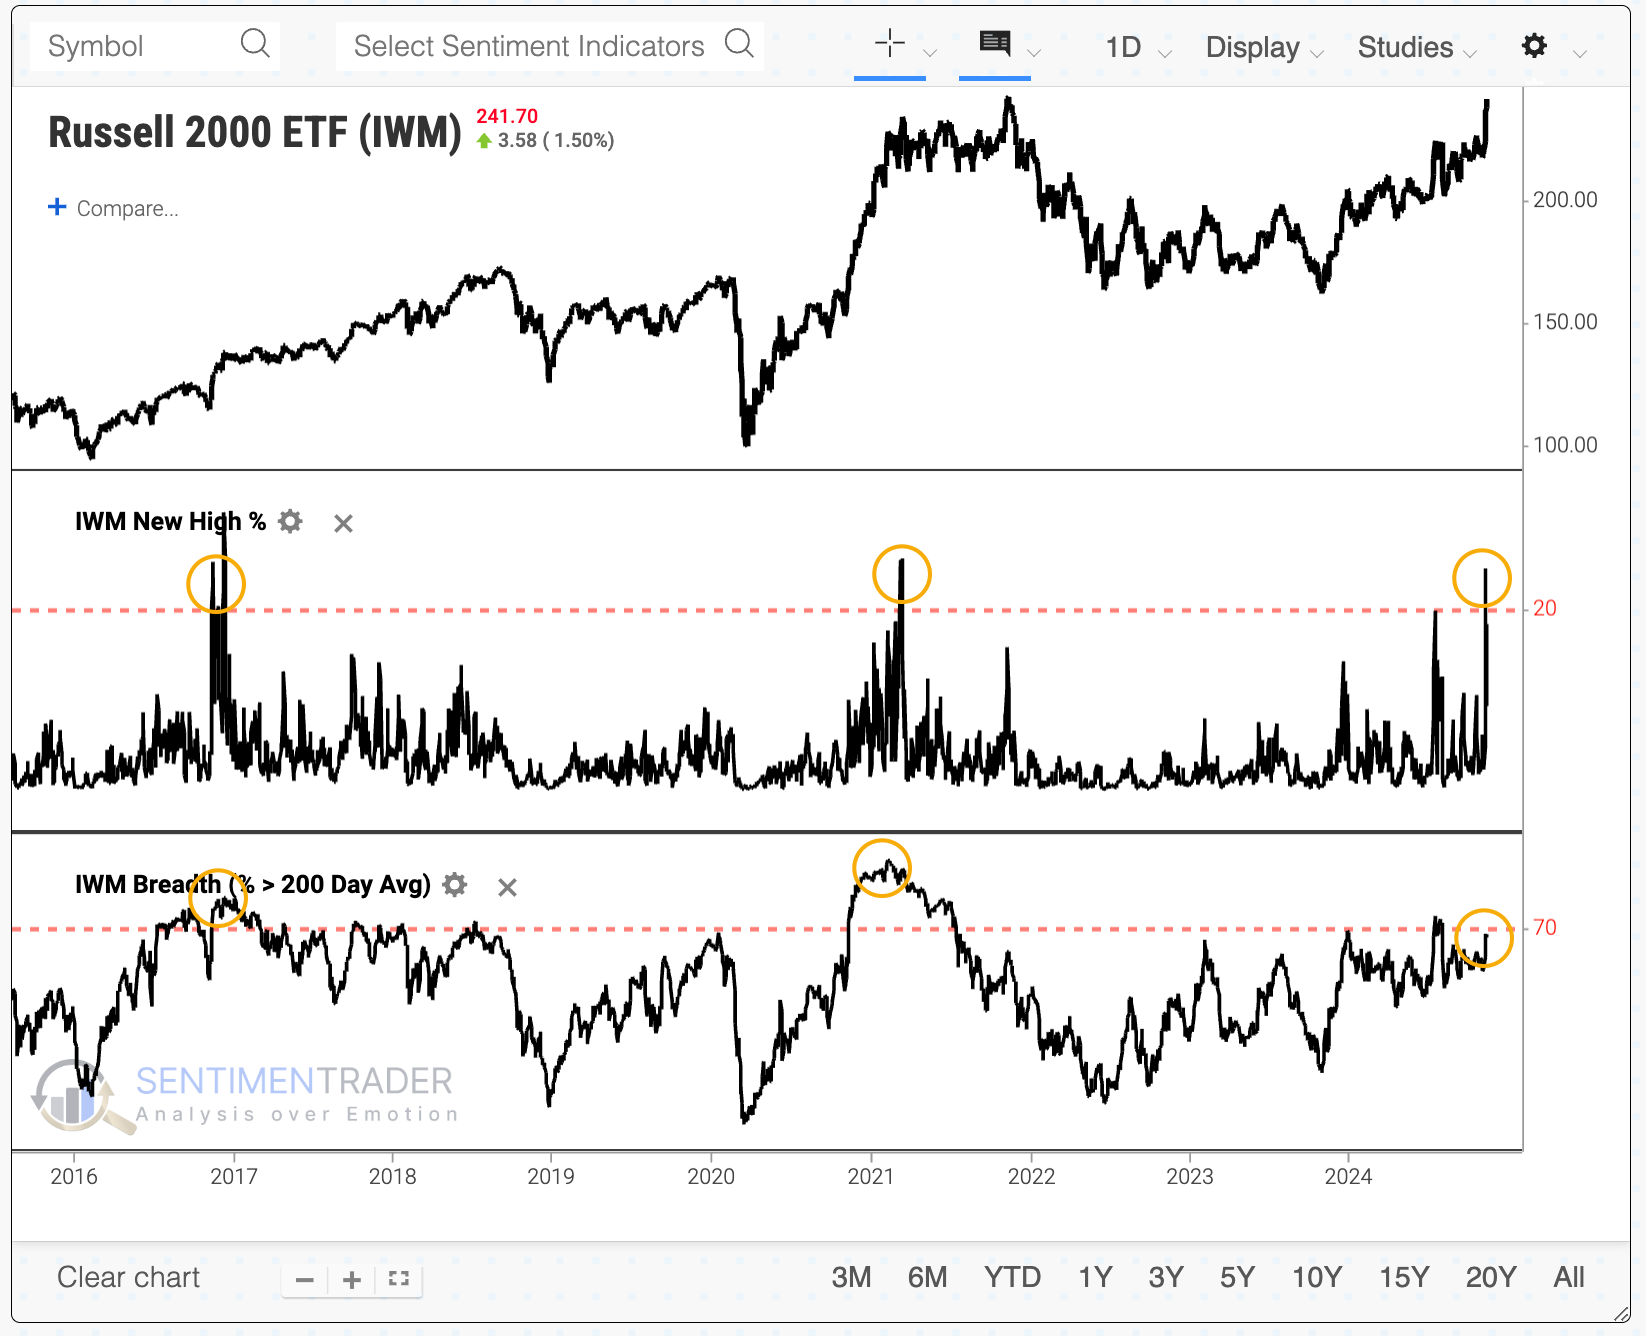
The initial reaction was impressive, with a massive rally in the Russell 2000 on Wednesday. The burst above prior resistance wasn't just in that index; it was also evident in many component stocks. Almost a quarter of Russell 2000 members scored a new high that day, the most in three years and the 3rd-most in 25 years.
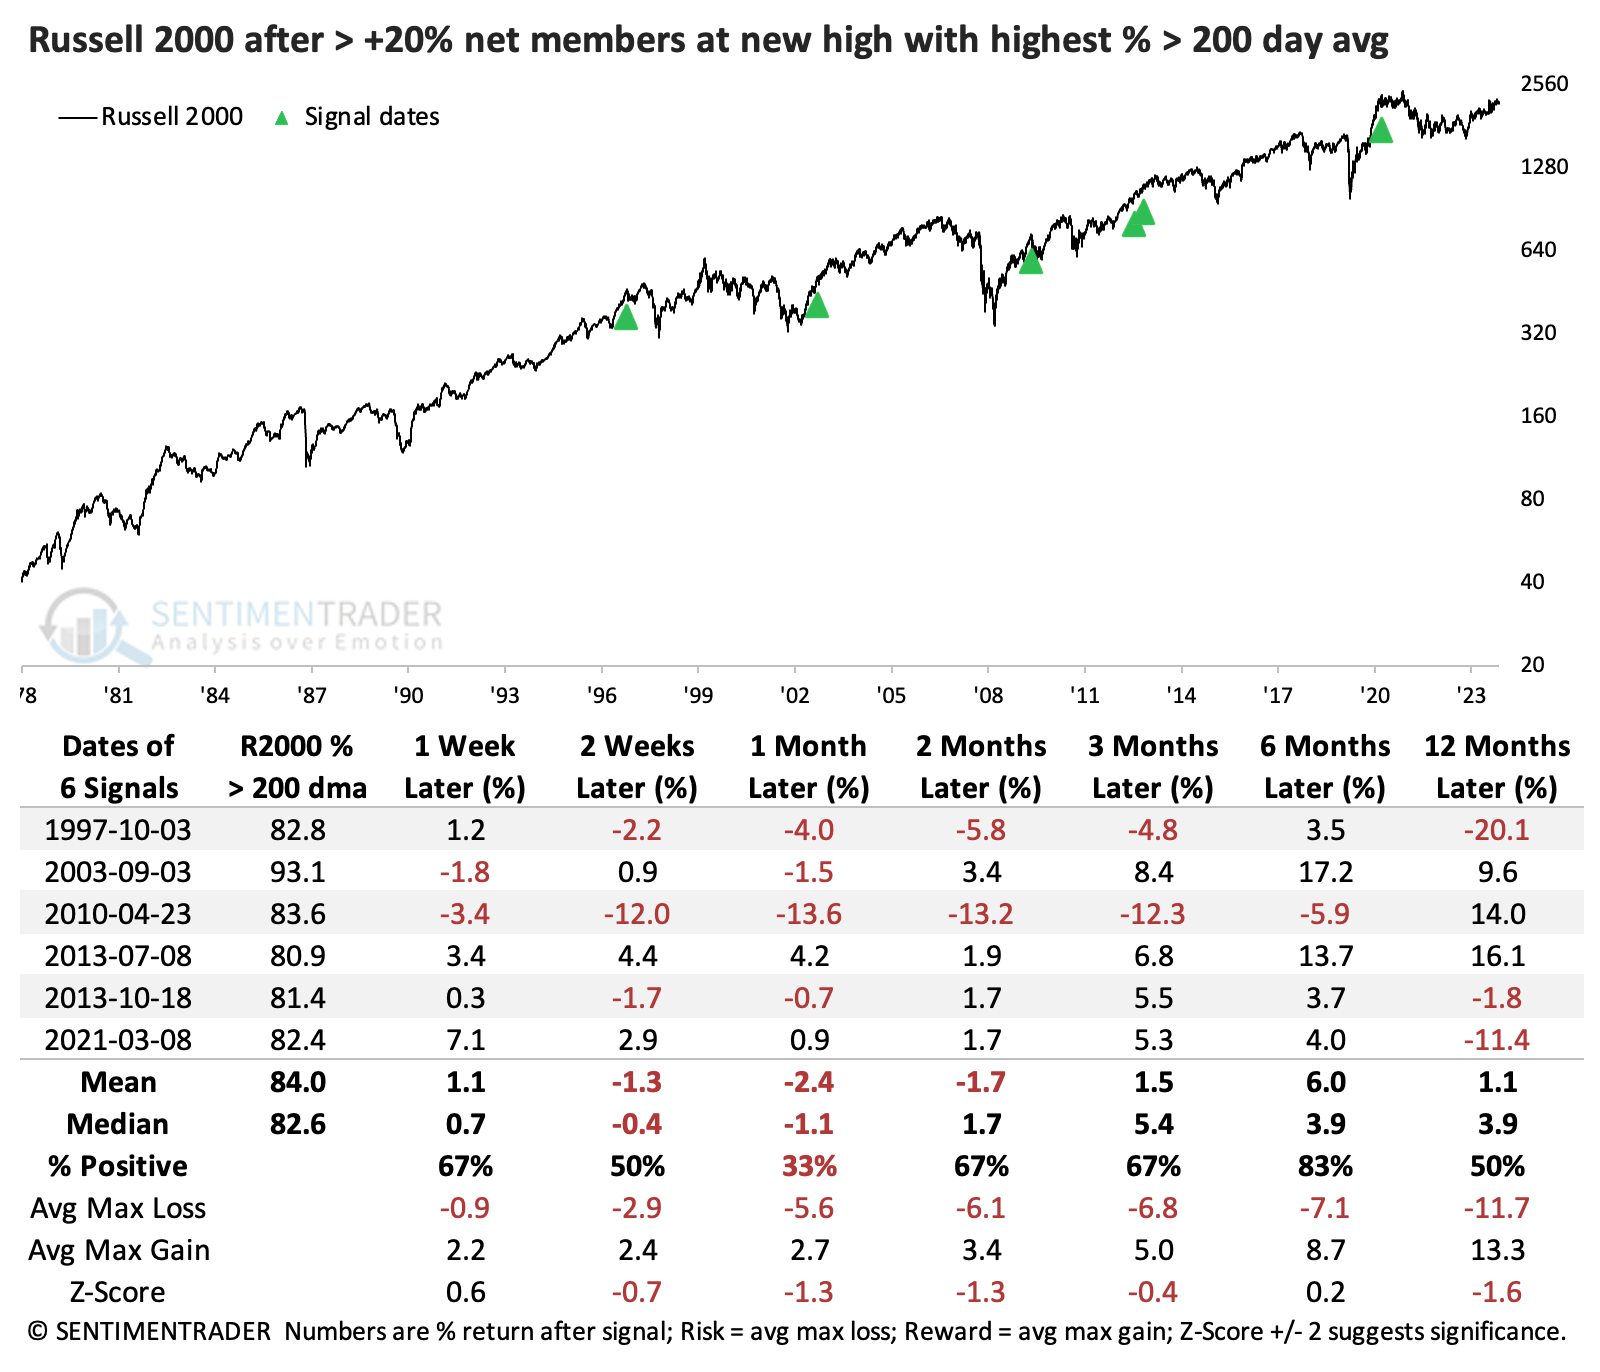
Curiously, though, fewer than three-quarters of Russell 2000 stocks are even trading above their 200-day moving averages. That makes the current jump in new highs unique among other breakouts over the past 45 years. On average, more than 80% of Russell 2000 stocks are trading above their 200-day averages on days when more than 20% of them score new highs. Fewer than 70% were this time.
The typical interpretation of this negative divergence would be, well, negative. We'd assume that fewer stocks in uptrends, as other small-cap stocks soared to new highs, would drag on forward returns.
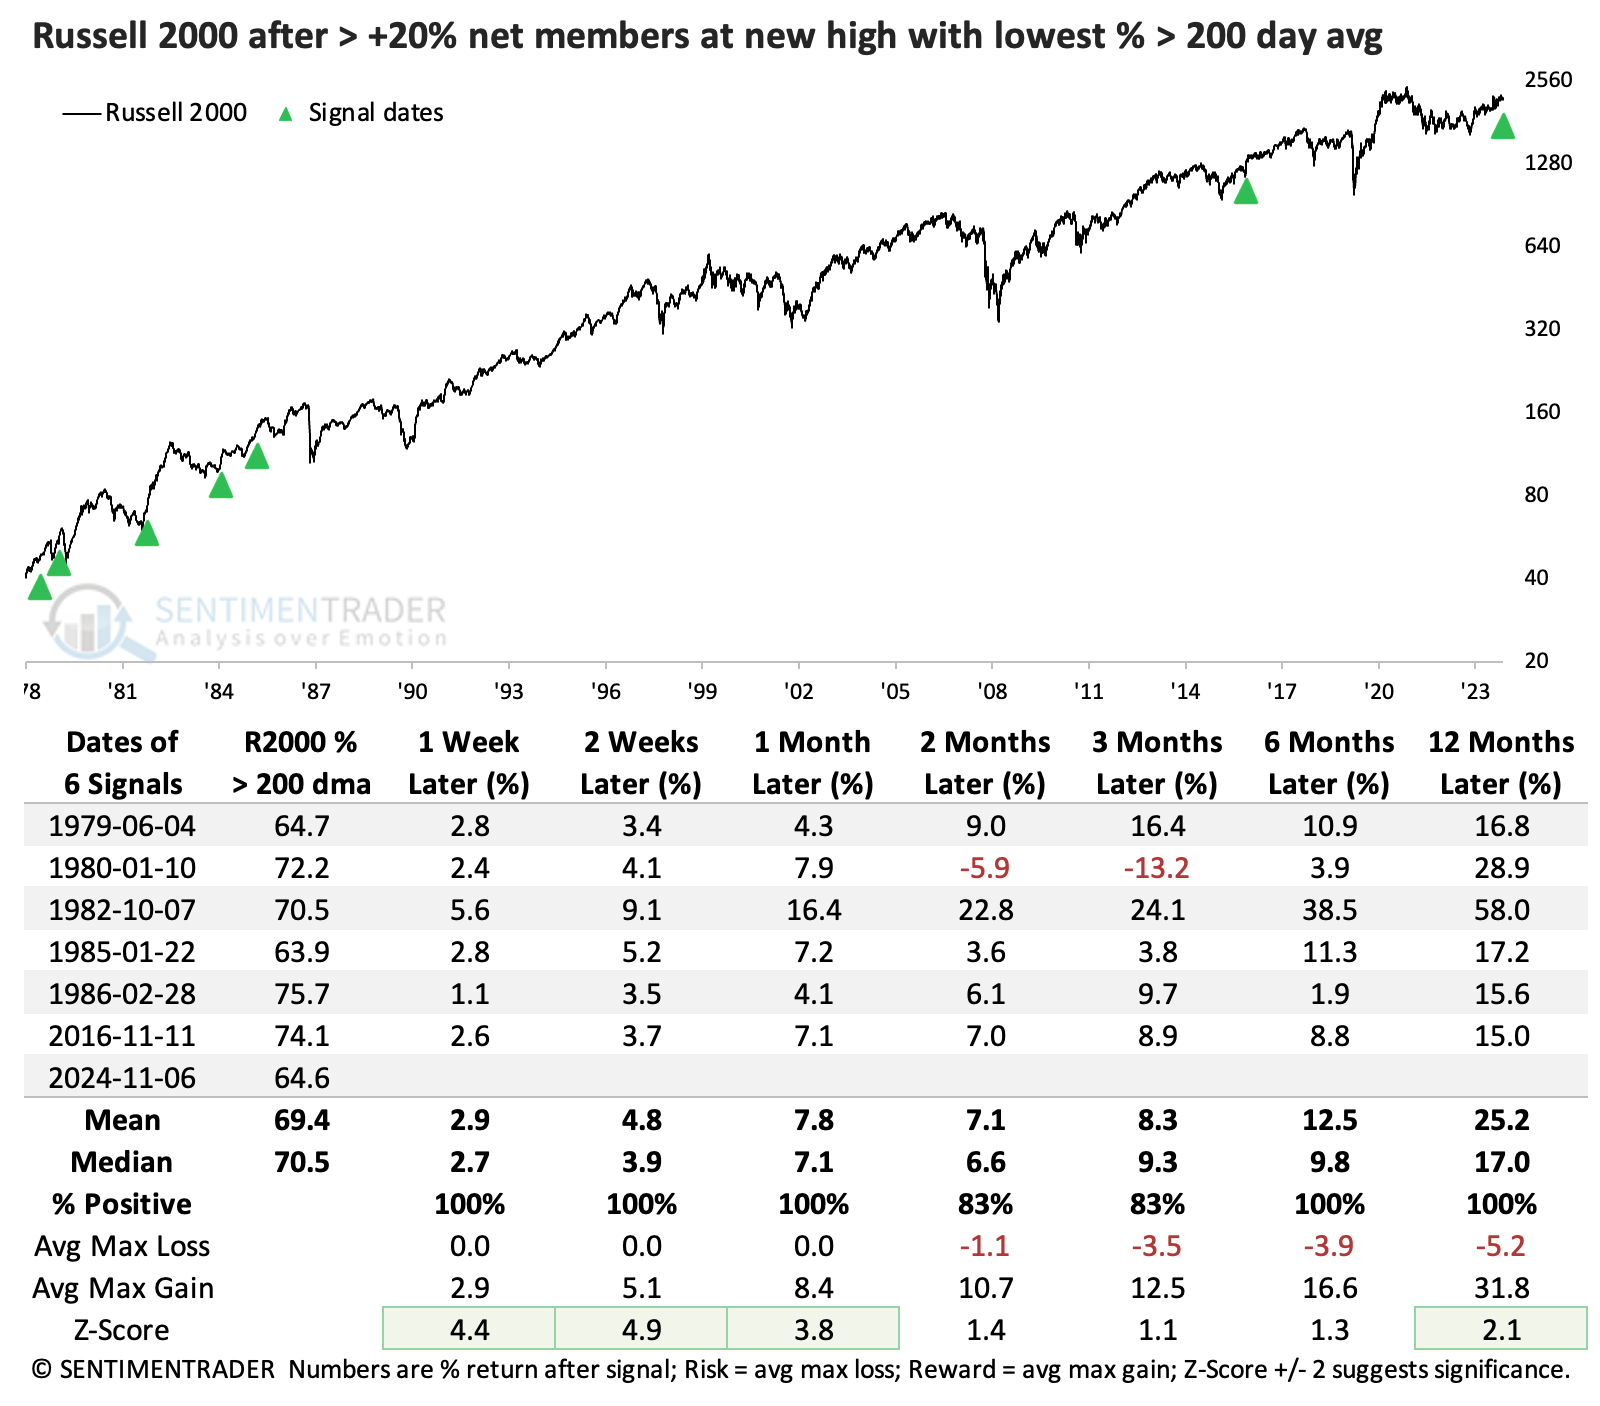
The table below shows those times when more than 20% of Russell 2000 stocks hit a new high for the first time in several months and the fewest percentage of stocks traded above their 200-day moving averages. The conclusion was clear - it made no difference. In fact, forward returns in the Russell were exemplary. There was one interruption in 1980, otherwise, the returns were unanimously positive, well above random, with low risk relative to reward.
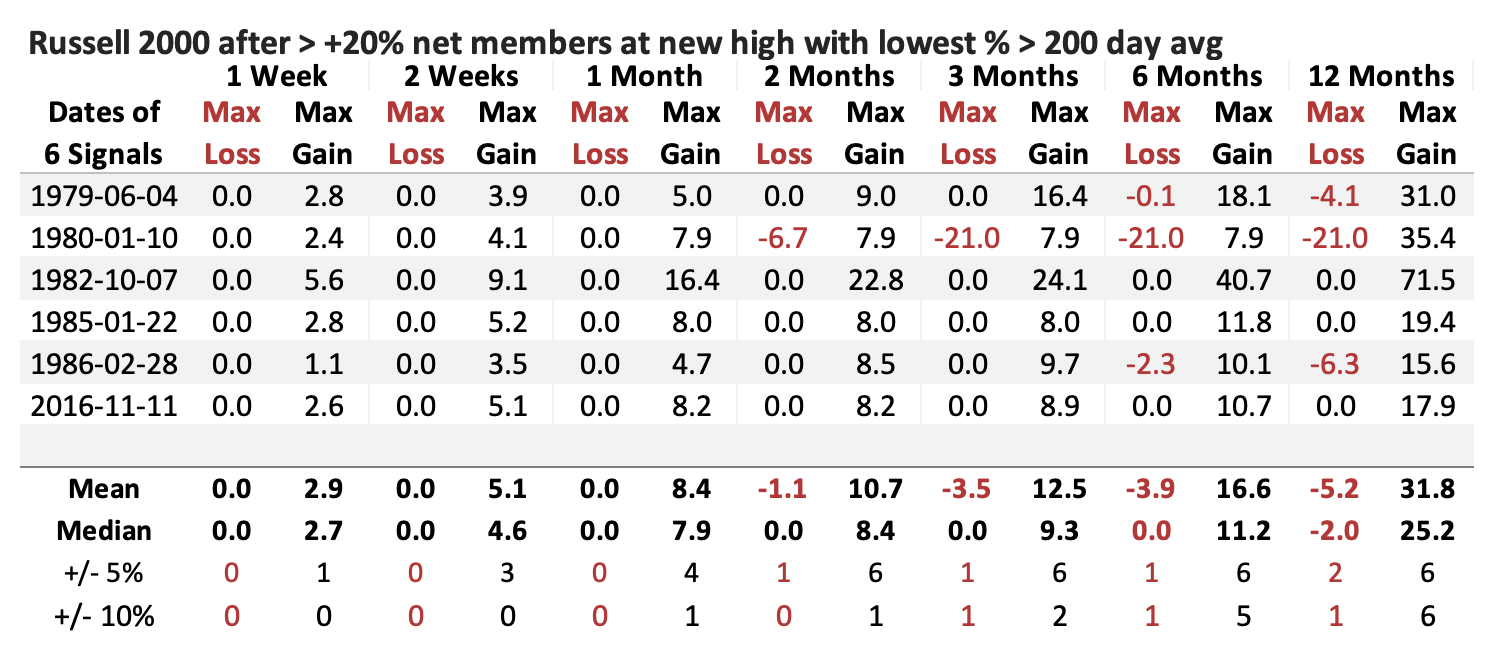
The table of maximum gains and losses across time frames shows few significant losses. Only the 1980 signal preceded any kind of notable drawdown - all the others were minimal, while all of them preceded double-digit gains.
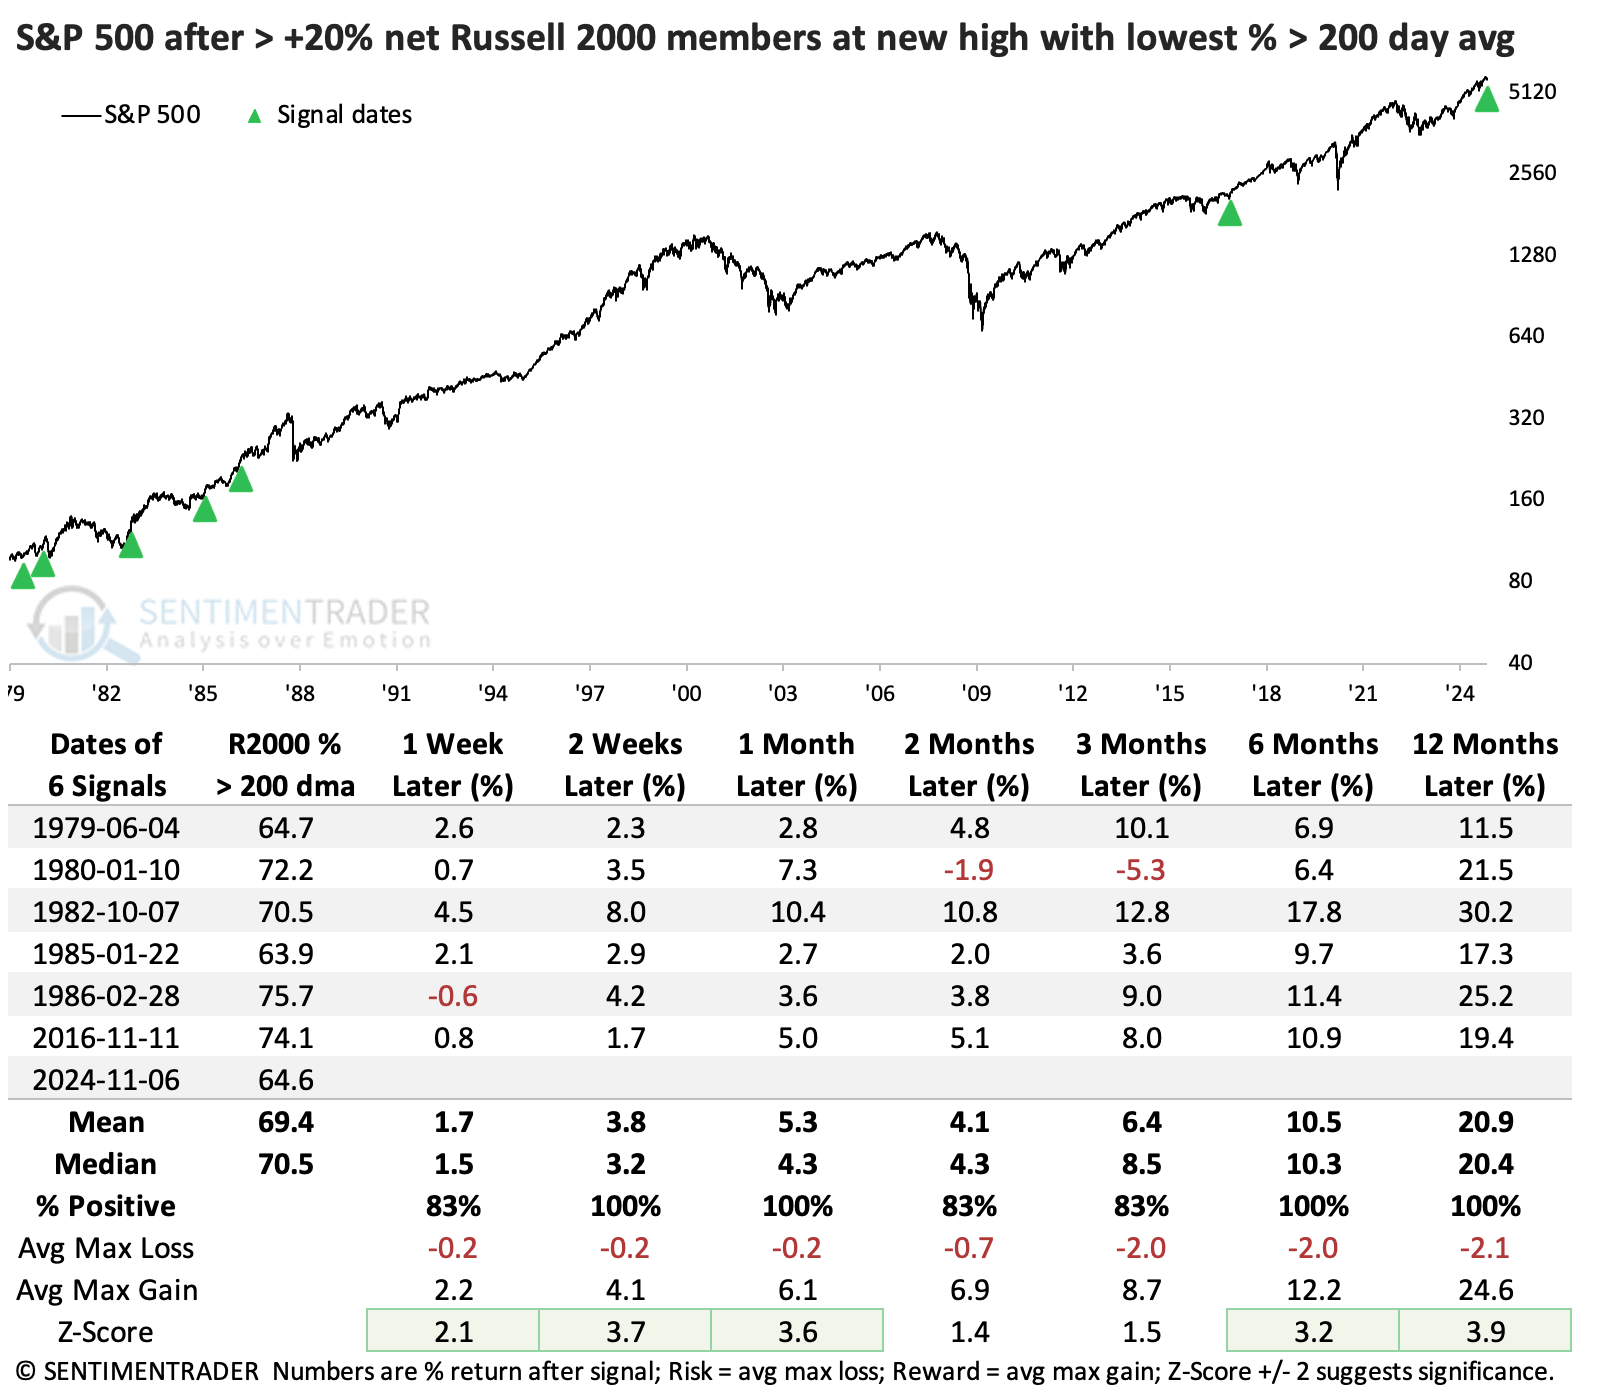
While the signal utilizes only small-cap data, when they are performing jumping, it is generally a good sign for stocks in general. The S&P 500 did very well after these signals, arguably even better from a risk/reward perspective.
Now, let's look at those times when more than 20% of Russell members hit a new high and participation was better, with the highest percentage of members above their 200-day moving averages. This should lead to better returns, but "should" isn't a given in auction markets.
We can see that below, with poor returns over the next month and below-average returns in the following year. The Russell has historically been subject to mean-reversion more than the S&P, so the index has struggled to add to its gains when things are firing on all cylinders.
 A record streak of underperformance
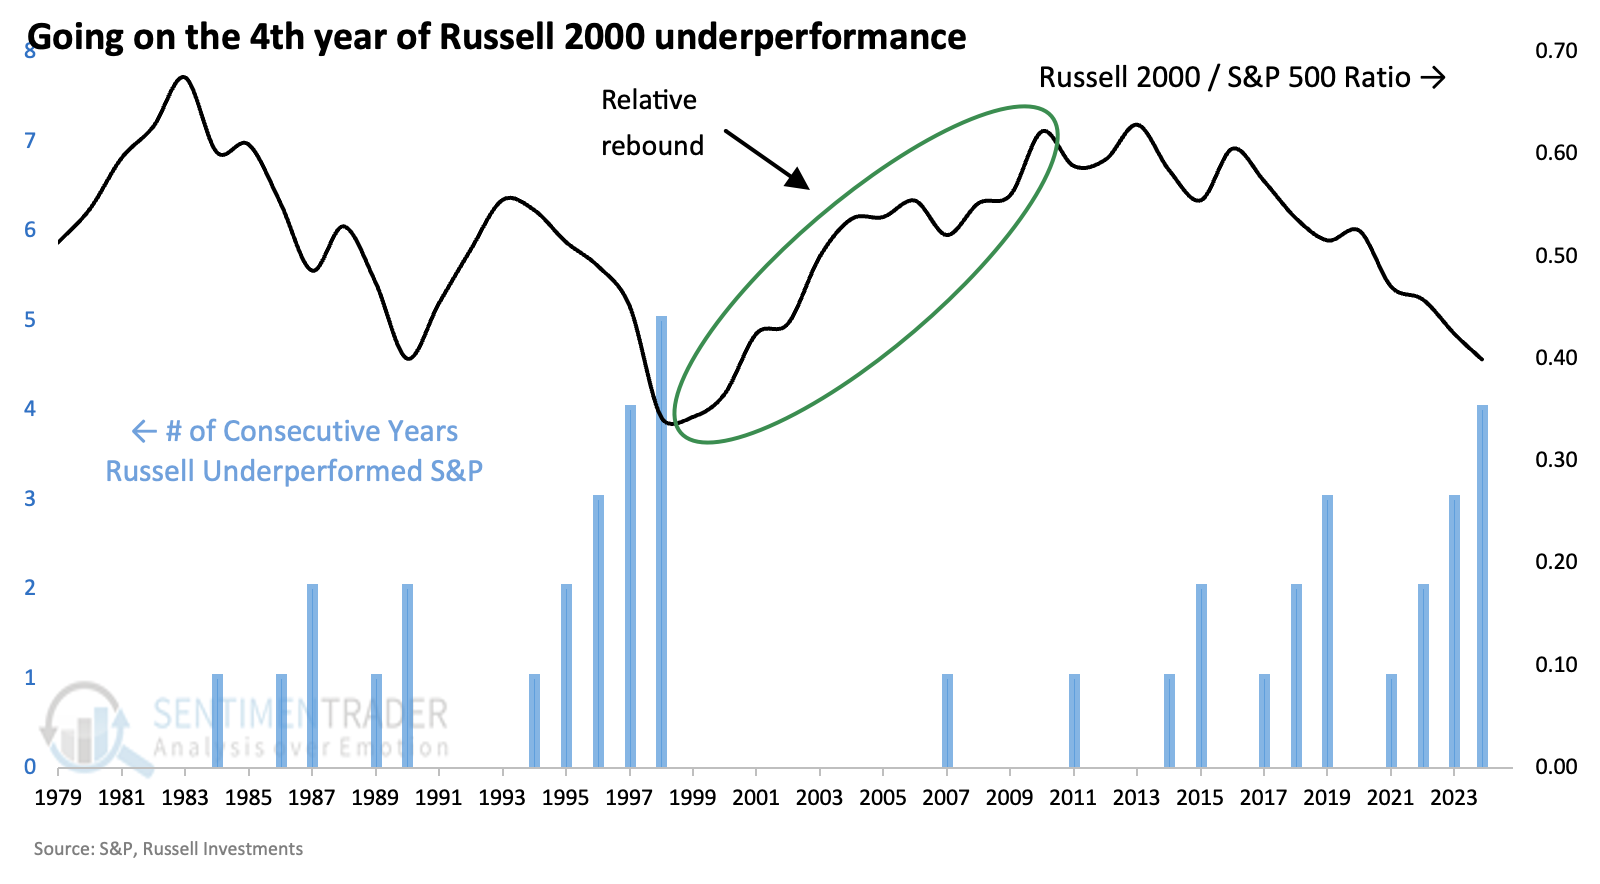
The Russell 2000 is on track to record its fourth consecutive year underperforming the S&P 500. Since the index's inception at the end of 1978, its underperforming streak has reached four years only once, in 1997. It underperformed again in 1998, then went on a wicked relative rebound over the following decade.
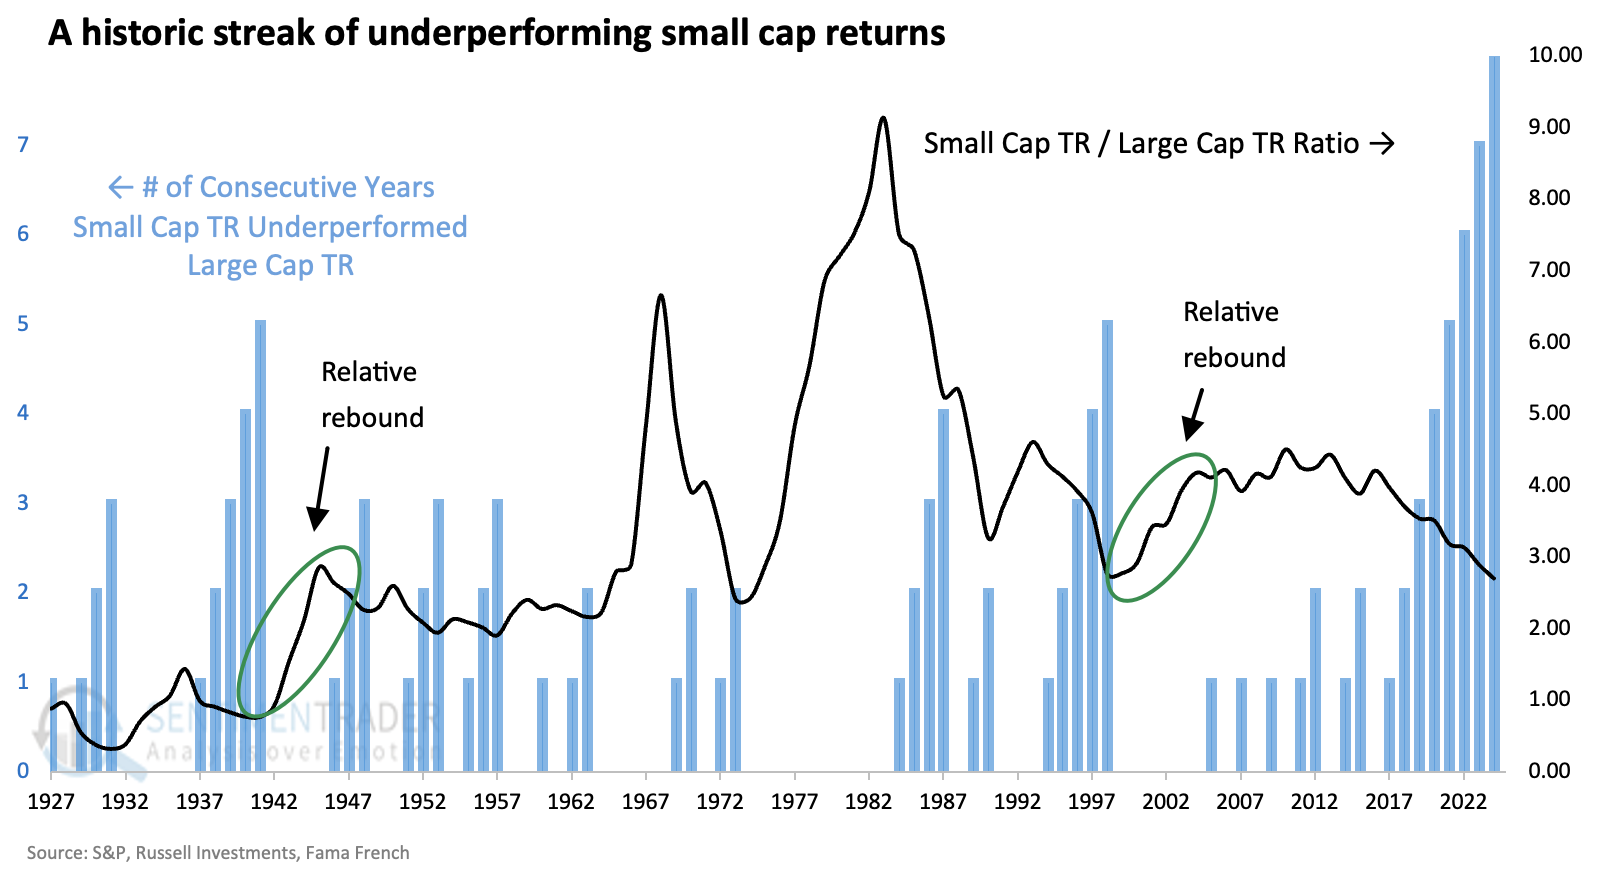
If we go back further using total return, the current streak of small-cap underperformance is unlike we've ever seen.
It has reached five years twice, both leading to half-decade relative rebounds. However, the current streak is eight years and counting, exceeding any historical comparison. We could reasonably expect small caps to exert dominance over large caps through 2030ish (roughly), but we could have started suggesting that a few years ago. We'd still be tilting at windmills.
What the research tells us...
Across many measures, including valuation, relative performance, and political environment, there are compelling reasons to expect small-cap stocks to finally show some relative strength relative to large-cap stocks. That argument could have reasonably been made for years, and yet here we are making the same argument. At some point, most contrarian arguments are proven correct, though that doesn't make them useful.
We're seeing perhaps the best evidence so far that we're on the cusp of such a mean-reversion move now. Not on a daily time frame but more weekly or monthly. There has been a jump in smaller stocks at new highs, and many still have room to move into uptrends, which has been a positive for future returns. That has especially been the case when they've been neglected for their bigger brothers for as many years as they have.