Products
SentimenTrader Trading Tools
‍
Backtest Engine
My Trading Toolkit
Correlation Analysis
Seasonality
Market Prediction
Indicators & Data API
‍
Proprietary Indicators & Charts
Market Data API
Strategies & Scanner
‍
50+ Trading Strategies
Smart Stock Scanner
Smart Option Scanner
Research Reports
‍
Research Solutions
Reports Library
Free Resources
Simple Backtest Calculator
Simple Seasonality Calculator
The Kelly Criterion Calculator
Sentiment Geo Map
Public Research Reports
Education
Sentiment Indicators
Technical Indicators
Pricing
Company
About
In the News
Testimonials
Client Success Stories
Contact
Log inLoginSign up
< BACK TO ALL REPORTS

Renewed strength in cyclical sector participation

Dean Christians
2025-08-25
Most stocks in cyclical sectors have reclaimed their 200-day moving averages. This kind of broad participation among economically sensitive groups has historically carried substantial implications for the overall market. In fact, similar instances have led to an S&P 500 rally 100% of the time over the following four months.

Key points: 

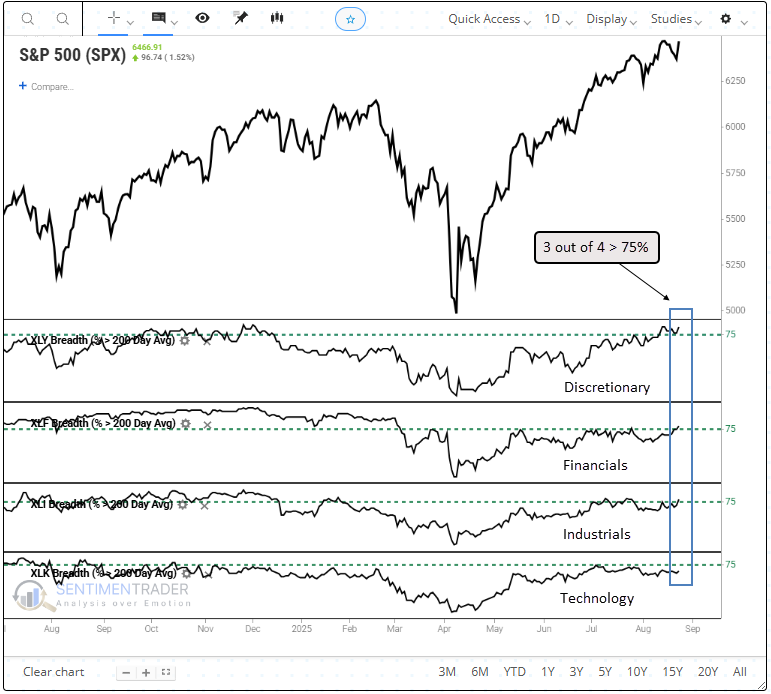
  • Over 75% of stocks in three of four cyclical sectors closed above their 200-day average
  • Similar breadth backdrops saw the S&P 500 rally without exception over the next four months 
  • Technology displayed the most consistent ability to outperform the broad market

Participation broadens

Market technicians had been voicing concerns about the lackluster participation, particularly in longer-term gauges such as the percentage of stocks trading above their 200-day moving average. That worry may now be easing, as last week brought a notable improvement in participation across the market. 

Cyclical sectors such as industrials, financials, and consumer discretionary led the rebound, with over 75% of their stocks simultaneously reclaiming 200-day averages for the first time since the April low.

Given the importance of economically sensitive stocks, this provides yet another encouraging sign for the durability of the uptrend. 

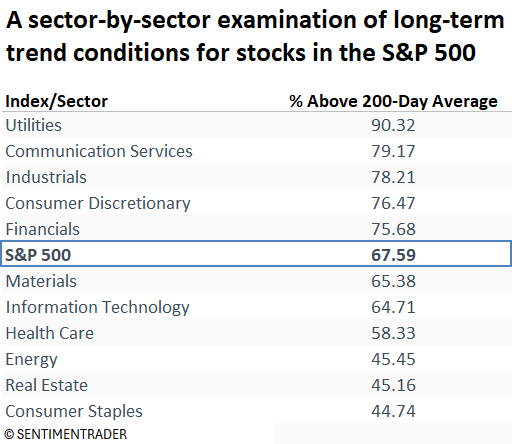
The percentage of S&P 500 stocks trading above their 200-day average has been held back by defensive, yield-oriented groups, which have been pressured by the "higher for longer" Treasury yield backdrop. 

With Chair Powell's Jackson Hole remarks hinting at rate cuts, relief for these groups could be on the horizon. If they begin to participate, it would further strengthen the underlying foundation of the market. 

A consistent upward bias

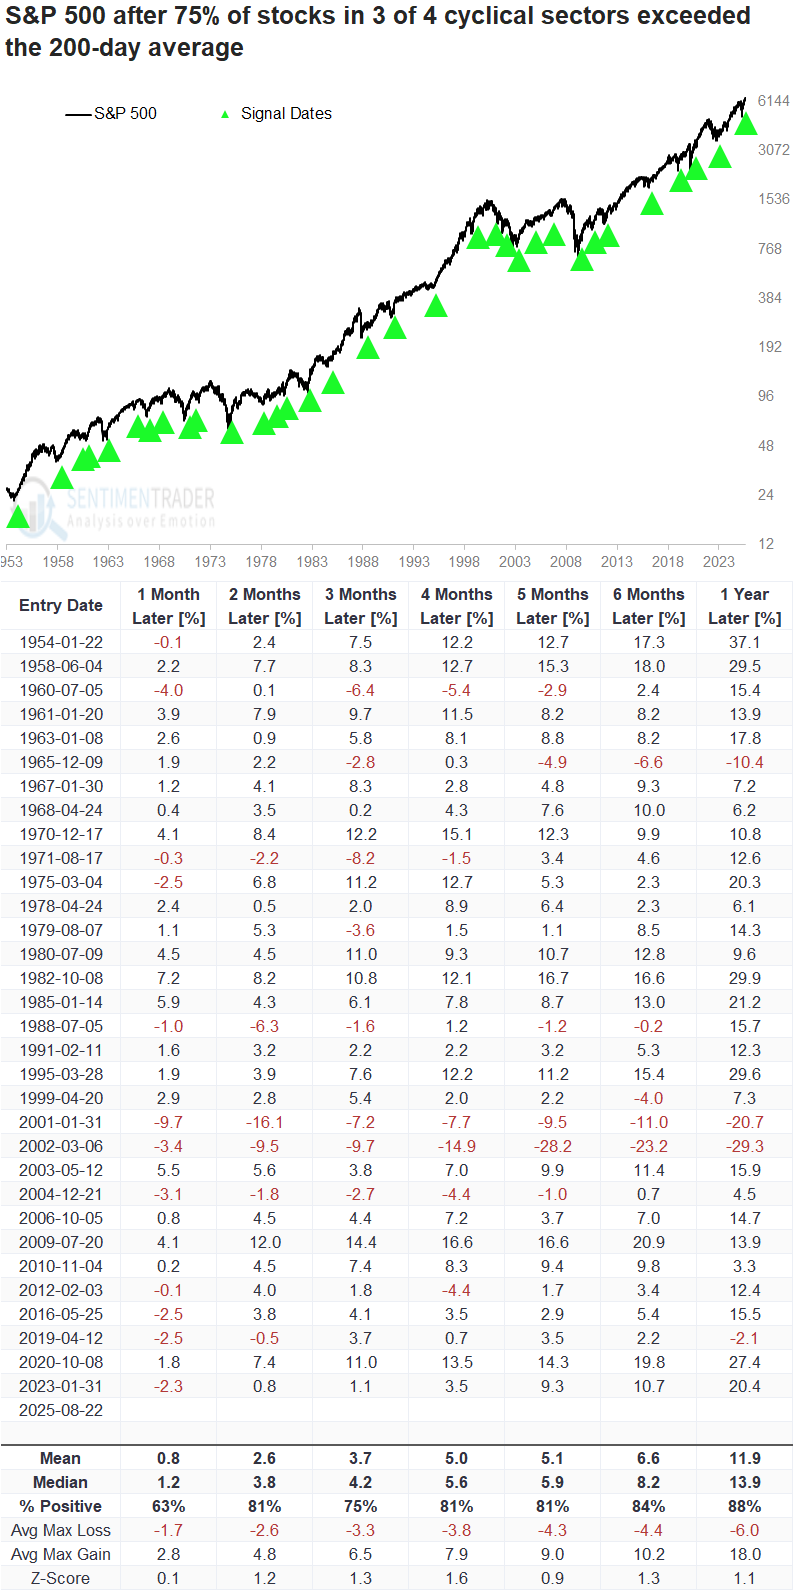
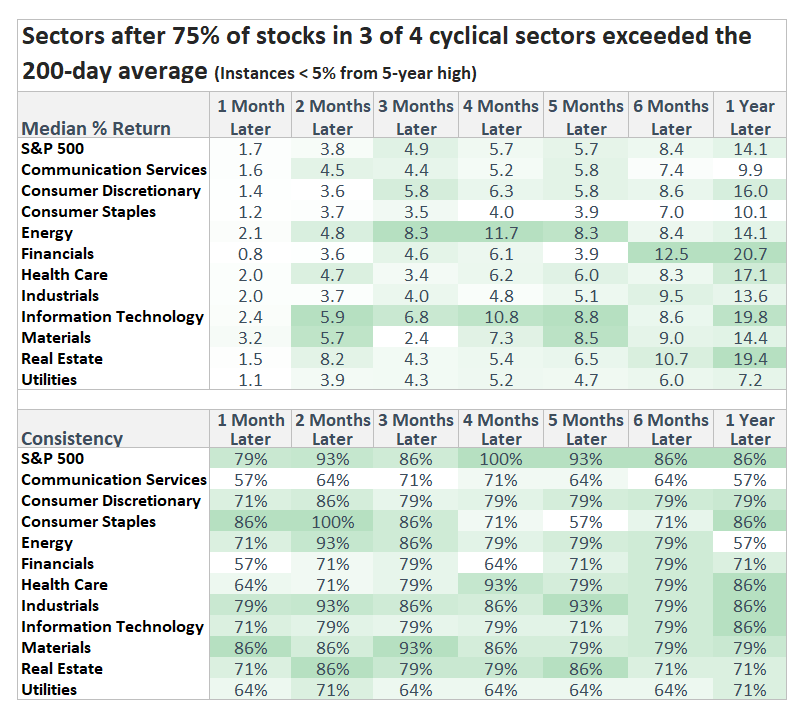
Whenever at least 75% of stocks in 3 of 4 cyclical sectors closed above their 200-day average for the first time after a six-month low, the S&P 500 delivered excellent returns and consistency over the following year. 

Only twice did the signal lead to significant declines in the first four months, with both occurring during countertrend rallies in the 2000-02 bear market, a scenario that contrasts sharply with today's conditions, as the S&P 500 nearly closed at a new all-time high on Friday. 

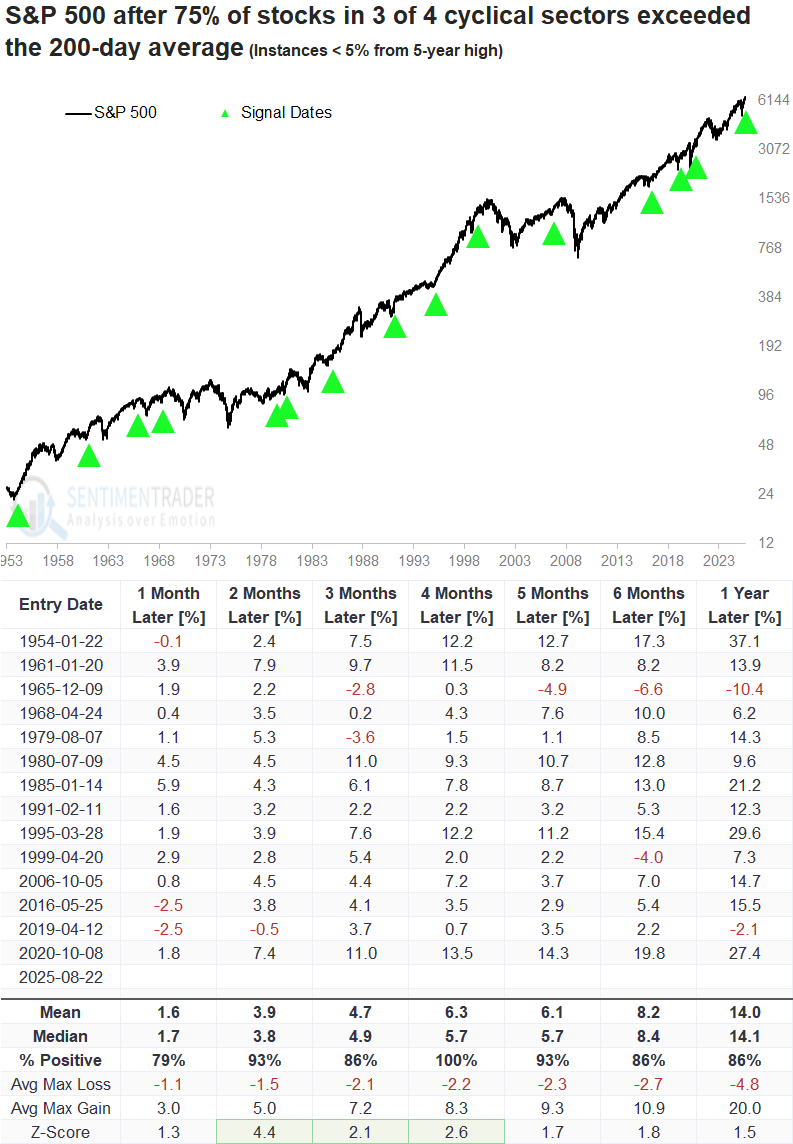
When isolating instances within 5% of a 5-year high, conditions more comparable to today, the S&P 500 demonstrated exceptional forward returns and consistency, achieving a 100% win rate at the four-month horizon. 

A year later, consumer discretionary, financials, and technology outperformed the S&P 500, suggesting investors were rewarded by overweighting these groups when cyclical sector stocks exhibited bullish long-term trend conditions.

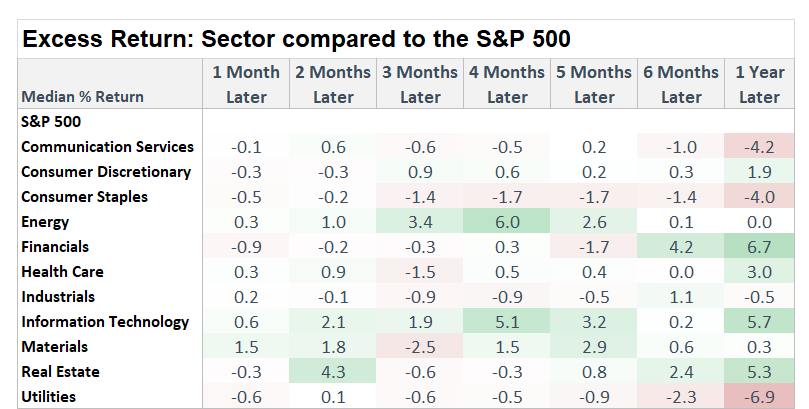
Measuring the net difference between a sector and the S&P 500 enhances the clarity of performance trends versus the broad market. 

As illustrated in the table below, the technology sector outperformed the world's most benchmarked index across all time frames. 

What the research tells us...

Cyclical groups continue to exhibit bullish characteristics, building on recent breakouts and sub-industry momentum. The latest signal comes from long-term trends, with over 75% of stocks in three of four major cyclical sectors now above their 200-day averages. Such strong participation near a high has historically led to robust gains over the following year, reinforcing the case for a sustainable uptrend.

PRODUCTS
SentimenTrader
Trading Tools
Indicators & Data API
‍
Strategies & Scanner
‍
Research Reports
FREE
RESOUrCES
Simple Backtest
Calculator
Simple Seasonality
Calculator
The Kelly Criterion
Calculator
Sentiment Geo Map
‍
Public Research Reports
‍
Education
Sentiment Indicators
‍
Technical Indicators
‍
Pricing
Bundle pricing
‍
FAQ
‍
Announcements
‍
COMPANY
‍
About
‍
In the News
‍
Testimonials
‍
Client Success Stories
CONTACT
‍
General Inquiries
‍
Media Inquiries
‍
Financial Professionals Inquiries
‍
© 2026 Sundial Capital Research Inc. All rights reserved.
Setsail Marketing
TermsPrivacyAffiliate Program
Risk Disclosure: The information and tools provided are for research and analytical purposes only and are not intended as investment advice. Market analysis involves uncertainty, and outcomes may differ from expectations. Users should conduct their own due diligence and consider their individual circumstances before making any financial decisions. Past performance is not necessarily indicative of future results.

Hypothetical Performance Disclosure: Hypothetical performance results have many inherent limitations, some of which are described below. No representation is being made that any account will or is likely to achieve profits or losses similar to those shown; in fact, there are frequently sharp differences between hypothetical performance results and the actual results subsequently achieved by any particular trading program. One of the limitations of hypothetical performance results is that they are generally prepared with the benefit of hindsight. In addition, hypothetical trading does not involve financial risk, and no hypothetical trading record can completely account for the impact of financial risk of actual trading. for example, the ability to withstand losses or to adhere to a particular trading program in spite of trading losses are material points which can also adversely affect actual trading results. There are numerous other factors related to the markets in general or to the implementation of any specific trading program which cannot be fully accounted for in the preparation of hypothetical performance results and all which can adversely affect trading results.

Testimonial Disclosure: Testimonials appearing on this website may not be representative of other clients or customers and is not a guarantee of future performance or success.