Products
SentimenTrader Trading Tools
‍
Backtest Engine
My Trading Toolkit
Correlation Analysis
Seasonality
Market Prediction
Indicators & Data API
‍
Proprietary Indicators & Charts
Market Data API
Strategies & Scanner
‍
50+ Trading Strategies
Smart Stock Scanner
Smart Option Scanner
Research Reports
‍
Research Solutions
Reports Library
Free Resources
Simple Backtest Calculator
Simple Seasonality Calculator
The Kelly Criterion Calculator
Sentiment Geo Map
Public Research Reports
Education
Sentiment Indicators
Technical Indicators
Pricing
Company
About
In the News
Testimonials
Client Success Stories
Contact
Log inLoginSign up
< BACK TO ALL REPORTS

Relative trends in the Asia-Pacific region look troubling

Dean Christians
2023-04-24
Over the last three months, not a single Asia-Pacific country ETF outperformed the S&P 500, the world's most-watched benchmark. After similar relative performance trends, the MSCI Asia-Pacific Index struggled over the next one to three months.

Key points:

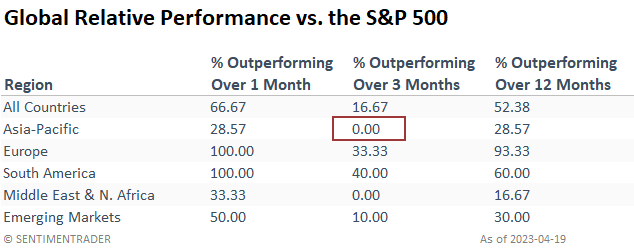
  • Not a single Asia-Pacific country ETF outperformed the S&P 500 over the last three months 
  • Similar relative performance trends did not bode well for absolute returns for the MSCI Asia-Pacific Index
  • When relative trends are weak over a three and twelve-month period, index returns are even worse

Poor relative trends tend to foreshadow weak absolute returns

In a previous note from February, I highlighted a deterioration in several breadth and price momentum indicators for the Asia-Pacific region, which suggested a cautious outlook. While the MSCI Asia-Pacific Index did not decline on an absolute basis, it did underperform the S&P 500. 

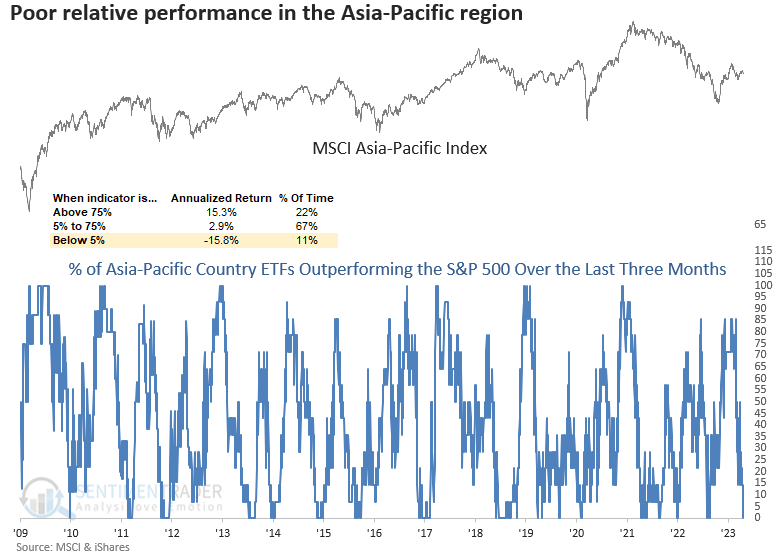
I'm now seeing relative performance trends in the export-driven manufacturing region take a turn for the worse. Over the last three months, not a single Asia-Pacific country ETF outperform the S&P 500. 

When fewer than 5% of Asia-Pacific country ETFs outperform the S&P 500 over three months, the MSCI Asia-Pacific Index shows an annual return of -15%.

The Asia-Pacific region looks weak relative to other areas around the globe, especially Europe, which I highlighted in a recent note.

Similar relative performance trends preceded negative returns

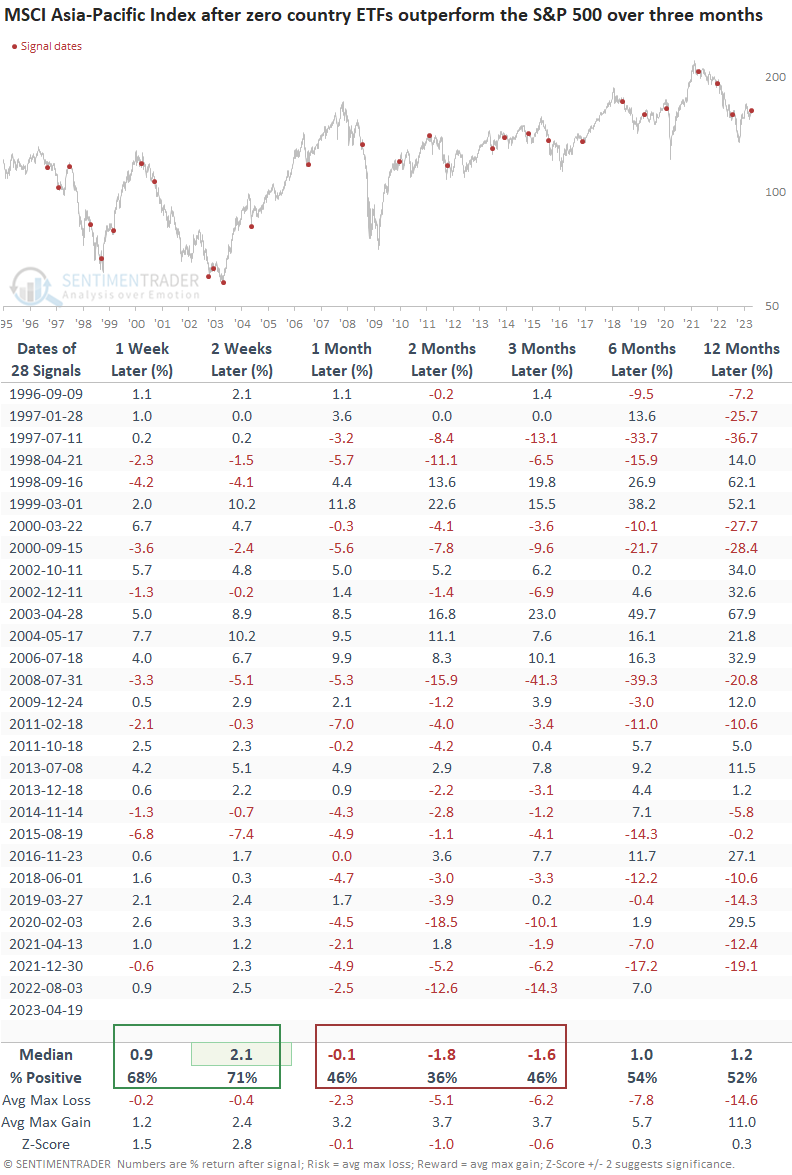
When not a single Asia-Pacific country ETF outperforms the S&P 500 over three months, the weak relative performance tends to presage an unfavorable outlook for the MSCI Asia-Pacific Index over the next one to three months. Since 2008, 14 out of 15 signals showed a negative return sometime in the next few months.

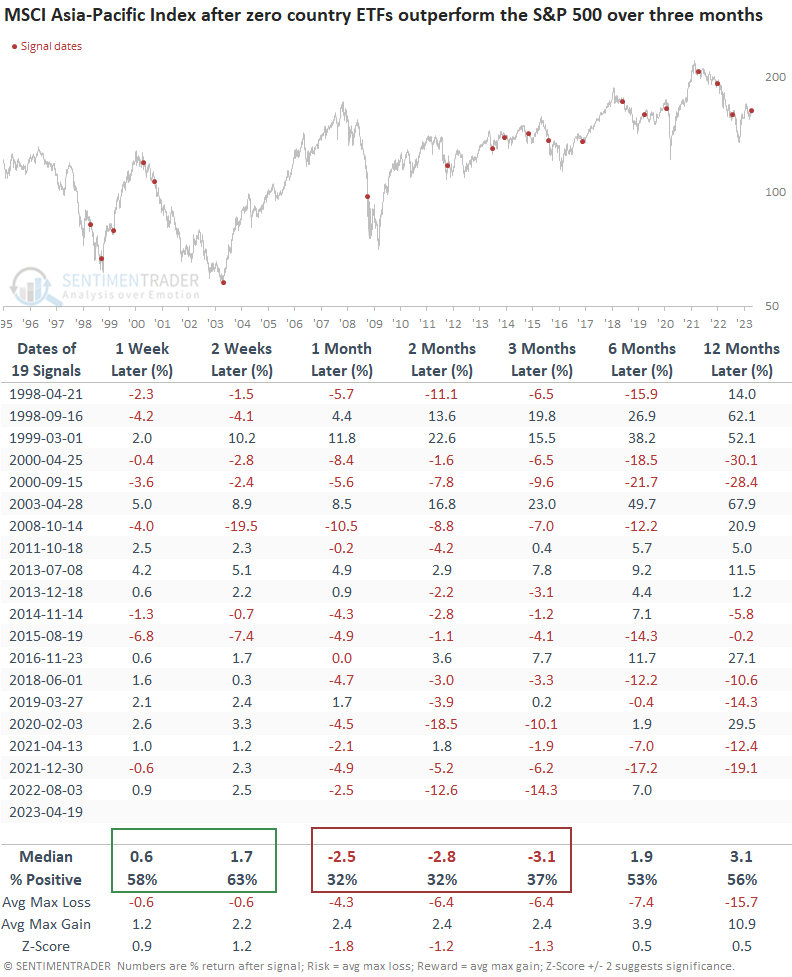
Given that only 28% of Asia-Pacific country ETFs outperformed the S&P 500 over a rolling 12-month period, let's add that condition to the original parameters for further context. However, I'll raise the 12-month threshold from 28% to 50% to capture more precedents.

When the percentage of ETFs outperforming the S&P 500 is weak over three and twelve months, all is not well in the export-driven manufacturing region. Forward returns for the MSCI Asia-Pacific Index look even worse in the one to the three-month horizon.

What the research tells us...

Relative performance for Asia-Pacific country ETFs have taken a turn for the worse. After similar periods of relative underperformance versus the S&P 500, the MSCI Asia-Pacific Index struggled over medium-term time frames. The outlook for the region is even worse when relative performance is weak across several horizons, like now.

PRODUCTS
SentimenTrader
Trading Tools
Indicators & Data API
‍
Strategies & Scanner
‍
Research Reports
FREE
RESOUrCES
Simple Backtest
Calculator
Simple Seasonality
Calculator
The Kelly Criterion
Calculator
Sentiment Geo Map
‍
Public Research Reports
‍
Education
Sentiment Indicators
‍
Technical Indicators
‍
Pricing
Bundle pricing
‍
FAQ
‍
Announcements
‍
COMPANY
‍
About
‍
In the News
‍
Testimonials
‍
Client Success Stories
CONTACT
‍
General Inquiries
‍
Media Inquiries
‍
Financial Professionals Inquiries
‍
© 2026 Sundial Capital Research Inc. All rights reserved.
Setsail Marketing
TermsPrivacyAffiliate Program
Risk Disclosure: The information and tools provided are for research and analytical purposes only and are not intended as investment advice. Market analysis involves uncertainty, and outcomes may differ from expectations. Users should conduct their own due diligence and consider their individual circumstances before making any financial decisions. Past performance is not necessarily indicative of future results.

Hypothetical Performance Disclosure: Hypothetical performance results have many inherent limitations, some of which are described below. No representation is being made that any account will or is likely to achieve profits or losses similar to those shown; in fact, there are frequently sharp differences between hypothetical performance results and the actual results subsequently achieved by any particular trading program. One of the limitations of hypothetical performance results is that they are generally prepared with the benefit of hindsight. In addition, hypothetical trading does not involve financial risk, and no hypothetical trading record can completely account for the impact of financial risk of actual trading. for example, the ability to withstand losses or to adhere to a particular trading program in spite of trading losses are material points which can also adversely affect actual trading results. There are numerous other factors related to the markets in general or to the implementation of any specific trading program which cannot be fully accounted for in the preparation of hypothetical performance results and all which can adversely affect trading results.

Testimonial Disclosure: Testimonials appearing on this website may not be representative of other clients or customers and is not a guarantee of future performance or success.