
Relative trends continue to favor value and defensive growth

Key points:
- Domestic sector and industry relative trend scores continue to favor value and defensive growth
- Energy, the best sector over the last few years, shows signs of deterioration, but nothing material
- On a global basis, relative performance for country ETFs surged to the highest level in two years
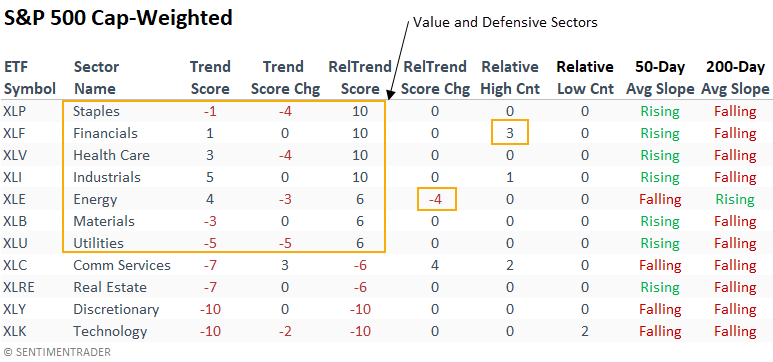
Value over cyclical growth continues to be the overriding theme in the cap-weighted S&P 500
Industrials and Financials continue to lead the value charge. At the same time, mega-cap constituents weigh on the relative trend score for the Technology and Consumer Discretionary sectors. The absolute and relative trend scores for Energy, the big winner in 2022, have deteriorated by a slight amount.
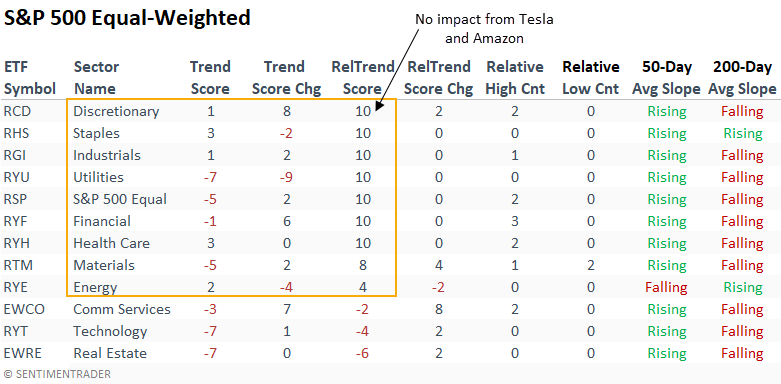
The equal-weighted relative scores, which provide an unbiased assessment of trends, suggest the average stock is doing better than the cap-weighted S&P 500.
Mega-cap components within Technology, Communication Services, and Consumer Discretionary sectors continue to weigh on the cap-weighted S&P 500 performance, especially in the Discretionary sector. However, that's not the case for the equal-weighted S&P 500 sectors.
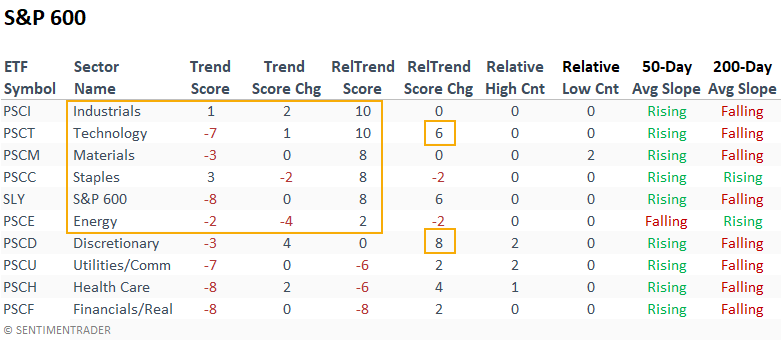
Most small-cap sectors look solid when compared to the S&P 500. Interestingly, the Technology and Consumer Discretionary sectors improved markedly over the last week, with significant relative trend score changes.
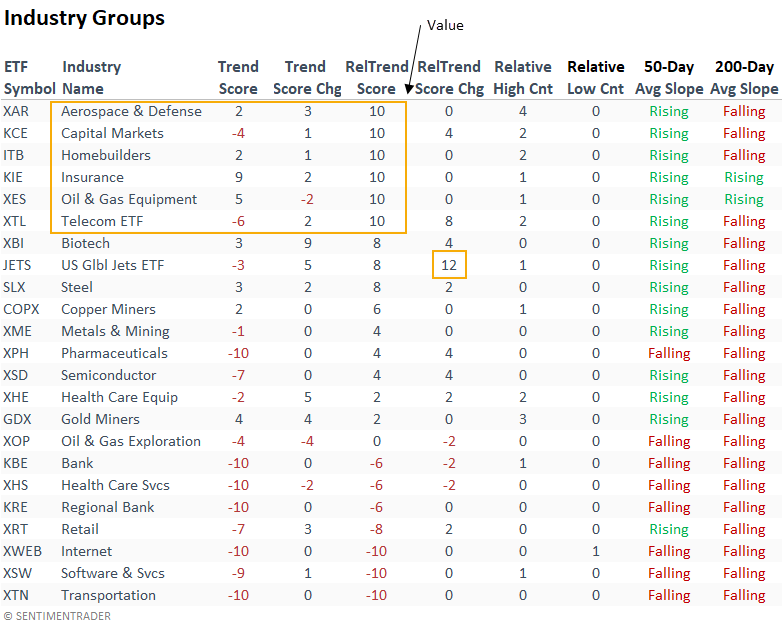
Industry ETF rankings confirm the sector message, with solid relative trend scores for value-oriented groups.
Global index relative trend score rankings versus the S&P 500 show noticeable improvement in the last few months. However, Country ETFs with higher weightings in natural-resource stocks, especially Energy, deteriorated in a meaningful way in Q4 2022.
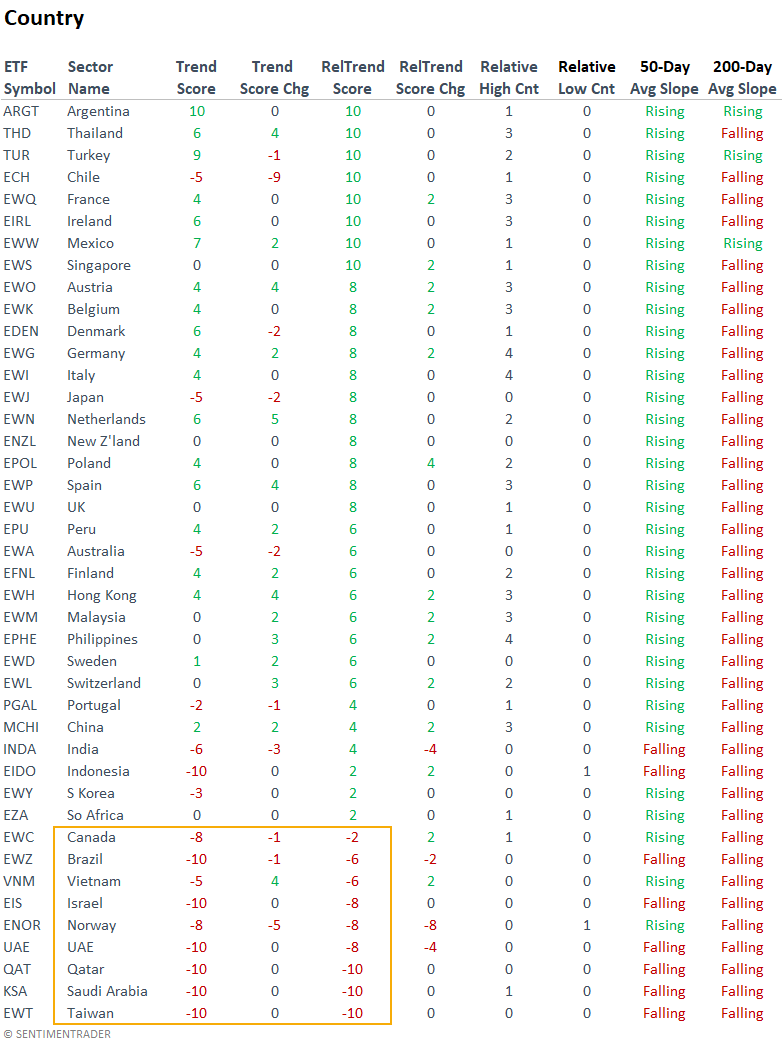
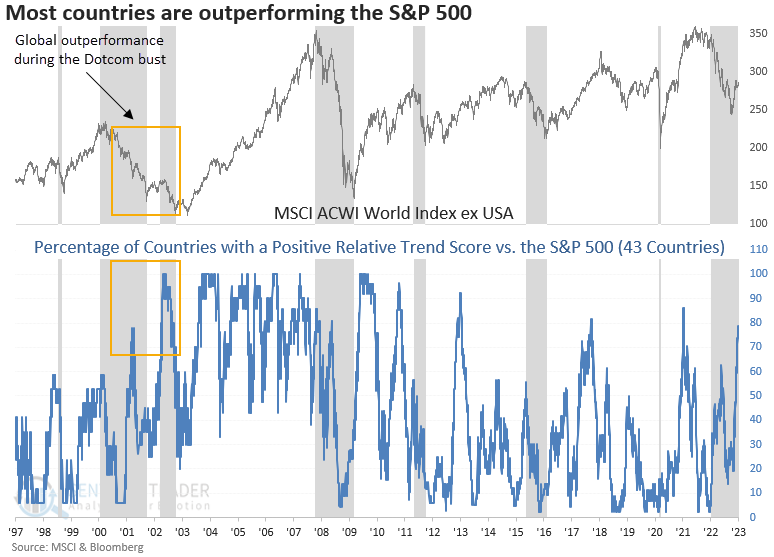
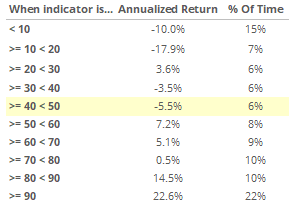
The percentage of country ETFs with a positive relative trend score versus the S&P 500 surged to the highest level in two years. While annualized returns are robust when more than 75% of ETFs have a positive relative score, most gains occur in absolute uptrends, which is not the case now. i.e., global indexes are the best house in a bad neighborhood.
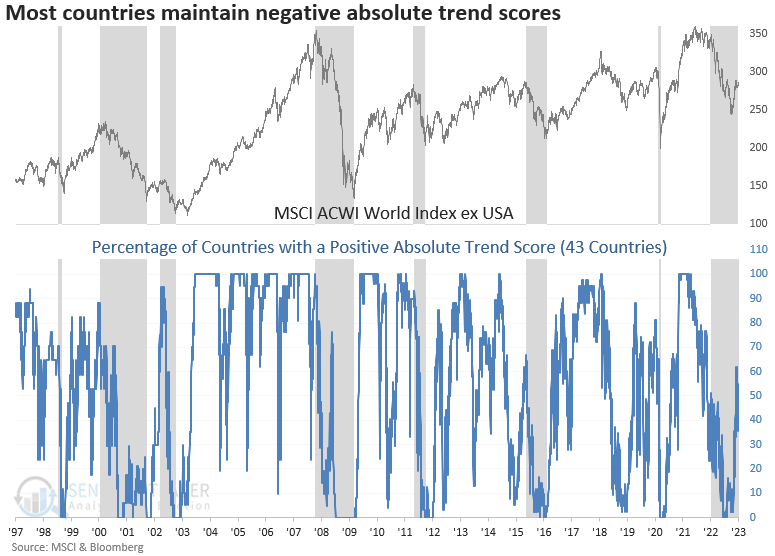
The percentage of country ETFs with a positive absolute trend score stands at 45%. While improving from low levels, the indicator remains in a position that is associated with negative annualized returns.
What the research tells us...
Domestic sector and industry ETFs exhibiting the highest relative trend scores maintain heavier weightings toward value-oriented and defensive-growth stocks. The mega-cap components in Technology, Communication Services, and Consumer Discretionary sectors continue to weigh on the cap-weighted S&P 500. Under the surface, the average stock is doing much better. While global ETF relative trends have improved markedly, absolute trends still suggest caution.
Absolute and relative trend column definitions
- Absolute Trend Count Score - The absolute trend model contains ten indicators to assess absolute trends across several durations.
- Absolute Trend 5-Day Change - This indicator measures the 5-day net change in the absolute trend model.
- Relative Trend Count Score - The relative trend model contains ten indicators to assess relative trends vs. the S&P across durations.
- Relative Trend 5-Day Change - This indicator measures the 5-day net change in the relative trend model.
- Relative High Count - This indicator measures the number of 21-day relative highs vs. the S&P 500 in the last five days.
- Relative Low Count - This indicator measures the number of 21-day relative lows vs. the S&P 500 in the last five days.
- 200-Day Avg Slope - This indicator measures whether the 200-day moving average is rising or falling.
- Absolute and Relative Trend Scores range from 10 (Best) to -10 (Worst)
Please click here for a note with details on the construction of the composite trend model.