Products
SentimenTrader Trading Tools
‍
Backtest Engine
My Trading Toolkit
Correlation Analysis
Seasonality
Market Prediction
Indicators & Data API
‍
Proprietary Indicators & Charts
Market Data API
Strategies & Scanner
‍
50+ Trading Strategies
Smart Stock Scanner
Smart Option Scanner
Research Reports
‍
Research Solutions
Reports Library
Free Resources
Simple Backtest Calculator
Simple Seasonality Calculator
The Kelly Criterion Calculator
Sentiment Geo Map
Public Research Reports
Education
Sentiment Indicators
Technical Indicators
Pricing
Company
About
In the News
Testimonials
Client Success Stories
Contact
Log inLoginSign up
< BACK TO ALL REPORTS

Relative trends around the globe look bullish

Dean Christians
2023-01-26
The percentage of global indexes with a positive relative trend score versus the S&P 500 recently exceeded 78%, representing the highest level in two years. Readings above 75% produce significantly better annual returns for a global index. Japan likes the newfound bullish relative trend backdrop as the USD-based ETF closed at a new 9-month high.

Key points:

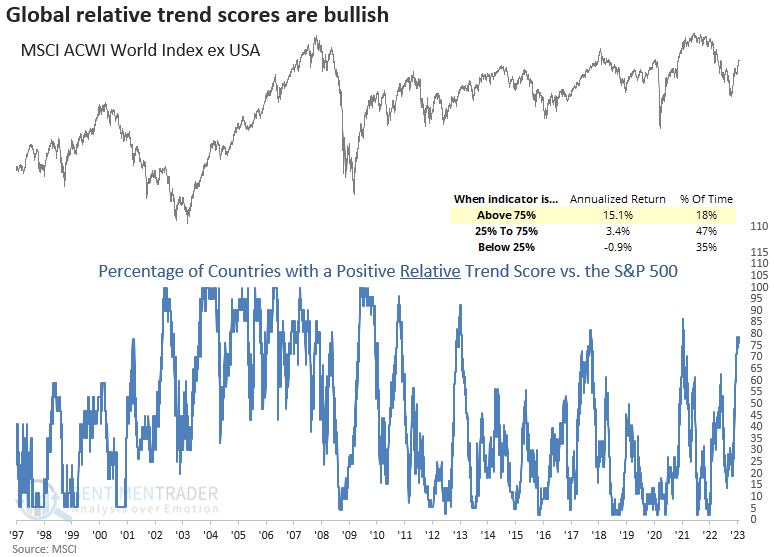
  • Over 78% of USD-based country ETFs maintain a positive relative trend score vs. the S&P 500
  • When the indicator exceeds 75%, a global index shows an annual return of 15.1% 
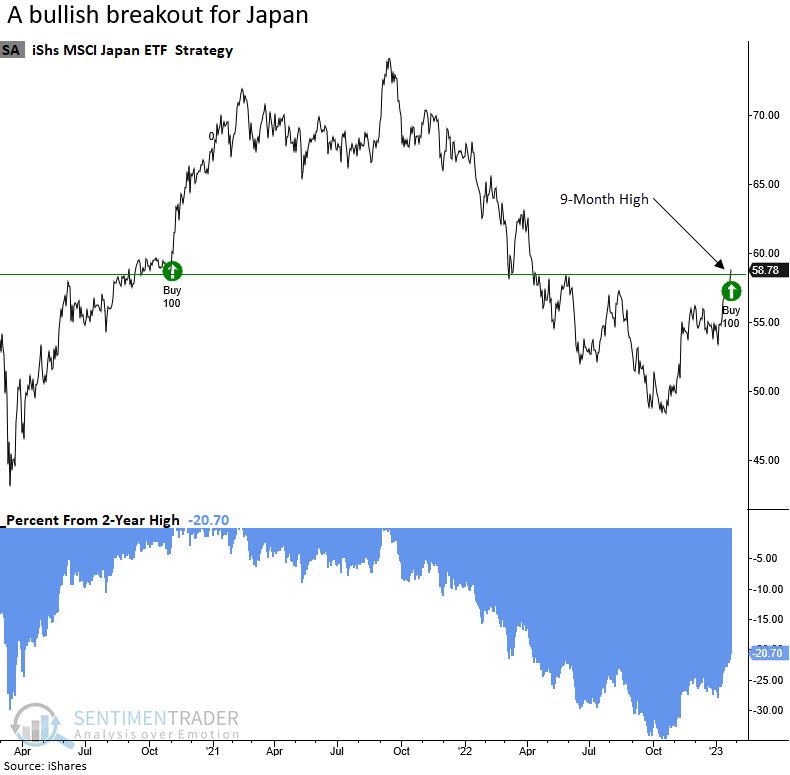
  • Japan closed at a 9-month high but not a 12-month high
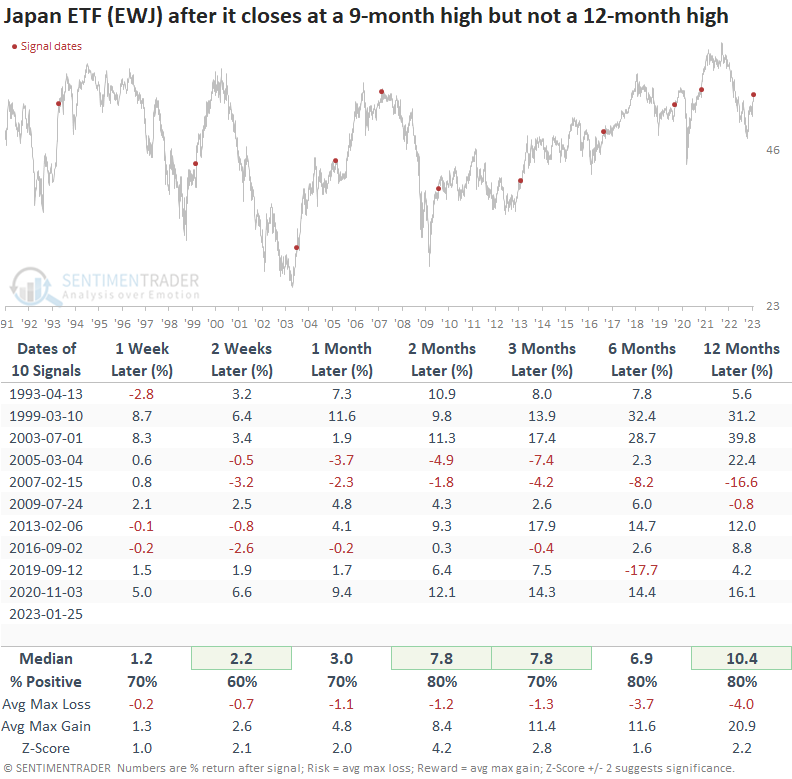
  • After similar breakouts, the ETF was higher 80% of the time over the next two months

Global trends transition from a headwind to a tailwind

Now that global equity indexes have recovered from bear markets and surged above long-term trend indicators, the current environment should yield more opportunities for investors and traders. 

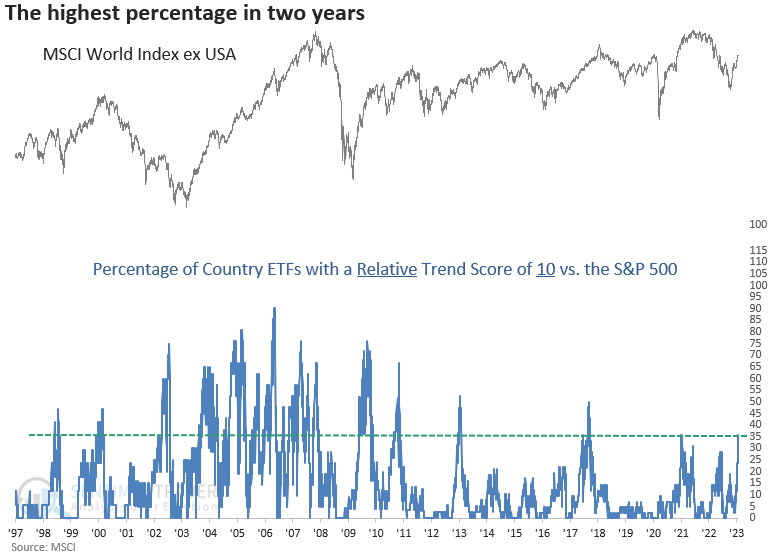
The percentage of country ETFs with a positive relative trend score versus the S&P 500 recently exceeded 78%, representing the highest level in two years. When the indicator increases above 75%, annual returns for the MSCI World Index ex USA surpass 15%. 

So, the global relative trend backdrop looks significantly better than the past couple of years.

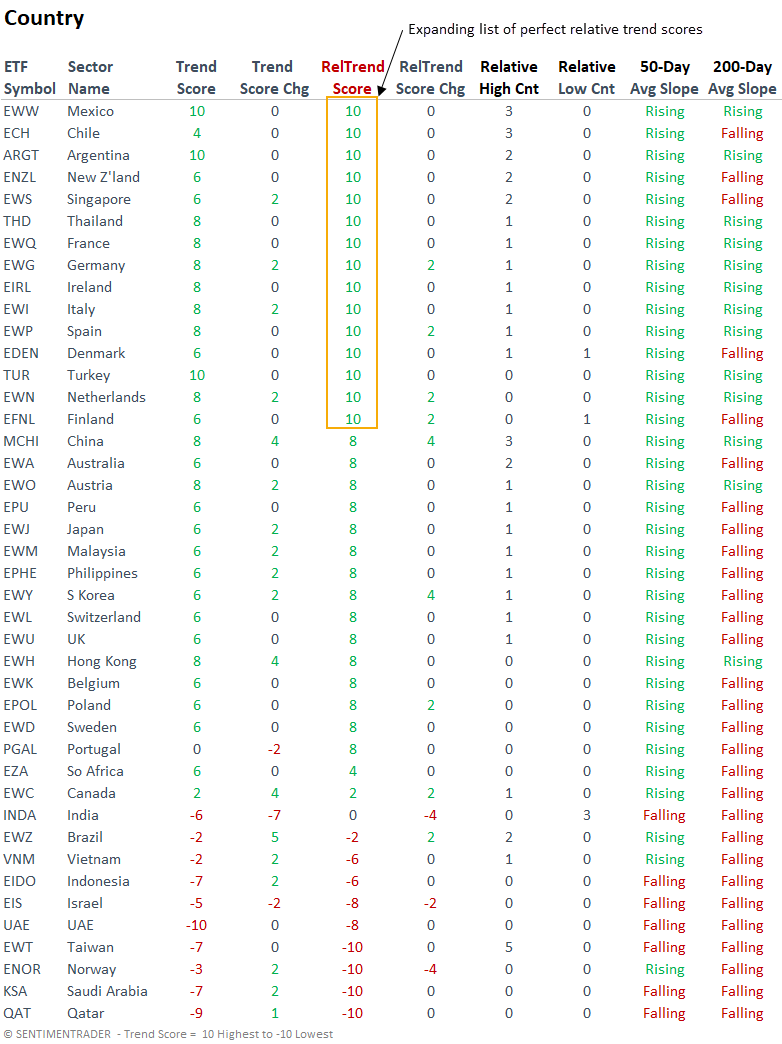
Not only is the list of country ETFs with a positive relative trend score versus the S&P 500 increasing, but the number of ETFs with a perfect score of +10 continues to expand.

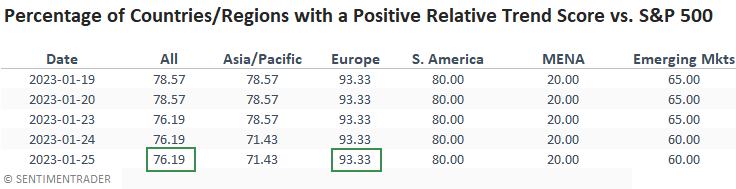
From a regional perspective, the Eurozone looks the best, with over 93% of the countries showing a positive score. 

Country ETFs look bullish on an absolute and relative basis

The number of country ETFs with positive absolute and relative trend scores continues to expand.

China and South Korea, two manufacturing-driven economies, had notable w/w relative trend score changes and registered several new relative highs versus the S&P 500.

A manufacturing/export-driven country closed at a new high

In recent notes, I highlighted breakouts in crude oil and semiconductors. We now have a similar breakout in a manufacturing/export-driven economy. On Wednesday, Japan closed at a new 9-month high but not a 12-month high. From a subjective perspective, the chart looks like an inverse head and shoulders pattern.

When the Japan ETF (EWJ) closes at a 9-month high but not a 12-month high, the ETF shows consistently bullish returns and z-scores across most time frames. One notable exception was a signal at the tail end of the 2003-07 bull market. 

What the research tells us...

Whether investing or trading, our chances of success are greatly improved if we have a tailwind at our back. With a broad global recovery in absolute and relative trends, we should have ample opportunities to exploit, despite a challenging macro environment. When the percentage of country ETFs with a positive relative trend score versus the S&P 500 exceeds 75%, annual returns for a global index improve dramatically. Japan is taking note of the bullish backdrop by breaking out to a new 9-month high. After similar breakouts, the Japanese ETF (EWJ) was higher 80% of the time over the next two months.

PRODUCTS
SentimenTrader
Trading Tools
Indicators & Data API
‍
Strategies & Scanner
‍
Research Reports
FREE
RESOUrCES
Simple Backtest
Calculator
Simple Seasonality
Calculator
The Kelly Criterion
Calculator
Sentiment Geo Map
‍
Public Research Reports
‍
Education
Sentiment Indicators
‍
Technical Indicators
‍
Pricing
Bundle pricing
‍
FAQ
‍
Announcements
‍
COMPANY
‍
About
‍
In the News
‍
Testimonials
‍
Client Success Stories
CONTACT
‍
General Inquiries
‍
Media Inquiries
‍
Financial Professionals Inquiries
‍
© 2026 Sundial Capital Research Inc. All rights reserved.
Setsail Marketing
TermsPrivacyAffiliate Program
Risk Disclosure: The information and tools provided are for research and analytical purposes only and are not intended as investment advice. Market analysis involves uncertainty, and outcomes may differ from expectations. Users should conduct their own due diligence and consider their individual circumstances before making any financial decisions. Past performance is not necessarily indicative of future results.

Hypothetical Performance Disclosure: Hypothetical performance results have many inherent limitations, some of which are described below. No representation is being made that any account will or is likely to achieve profits or losses similar to those shown; in fact, there are frequently sharp differences between hypothetical performance results and the actual results subsequently achieved by any particular trading program. One of the limitations of hypothetical performance results is that they are generally prepared with the benefit of hindsight. In addition, hypothetical trading does not involve financial risk, and no hypothetical trading record can completely account for the impact of financial risk of actual trading. for example, the ability to withstand losses or to adhere to a particular trading program in spite of trading losses are material points which can also adversely affect actual trading results. There are numerous other factors related to the markets in general or to the implementation of any specific trading program which cannot be fully accounted for in the preparation of hypothetical performance results and all which can adversely affect trading results.

Testimonial Disclosure: Testimonials appearing on this website may not be representative of other clients or customers and is not a guarantee of future performance or success.