
Regarding "The Summer Rally"...

Key Points
- The supposed "Summer Rally" in the stock market is one of those adages thrown around but rarely defined
- This piece takes a closer look at the stock market's performance during the summer months of June, July, and August as a whole
- We will also zero in on the generally recognized "Summer Rally Period"
June through August S&P 500 performance
The chart below displays the cumulative price return for the S&P 500 Index if held long ONLY during June, July, and August, every year from 1942 through June 23, 2025.
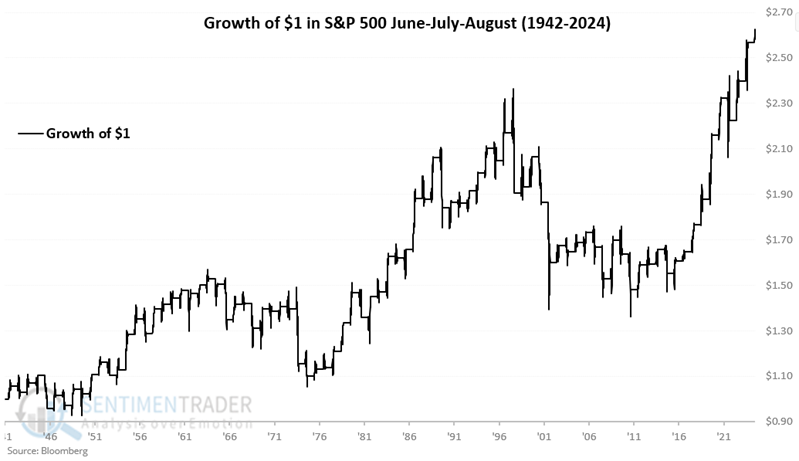
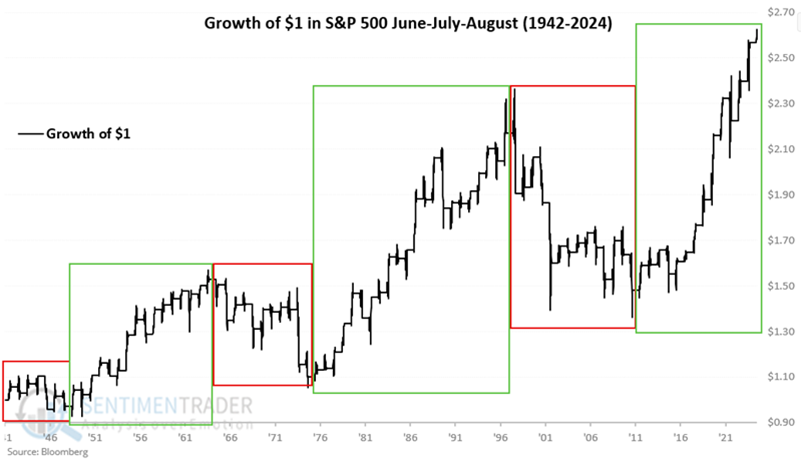
The chart below highlights that "summer months" tend to be mostly favorable for several years at a time, and then mostly unfavorable for years at a time. June/July/August have been mostly favorable since 2012.
For the record, starting in 1942:
- June through August SPX cumulative % +(-) = +162%
- All other months cumulative % +(-) = +26,387%
While the stock market has shown a positive overall performance during the summer months, these months have not been the most dynamic time of year for the stock market over the past eight decades.
Let's focus on the generally recognized "Summer Rally" period, versus the rest of the summer.
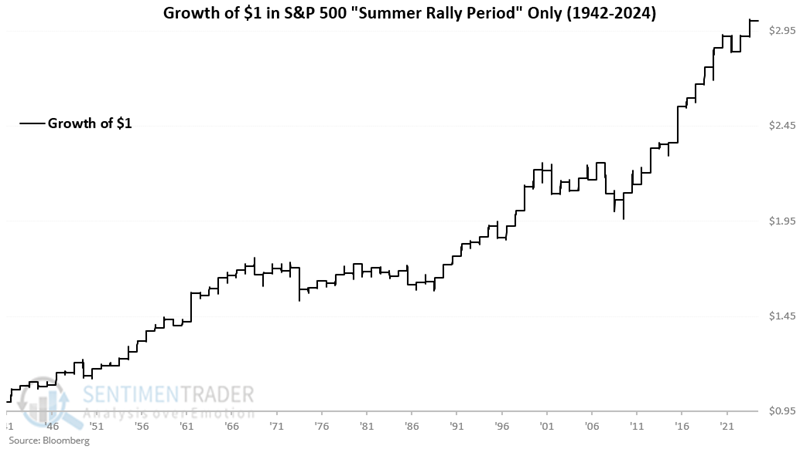
The Summer Rally Period
The "Summer Rally Period" is generally recognized to be:
- The last three trading days of June
- The first nine trading days of July
For 2025, this period begins at the close on 2025-06-25 and ends at the close on 2025-07-14.
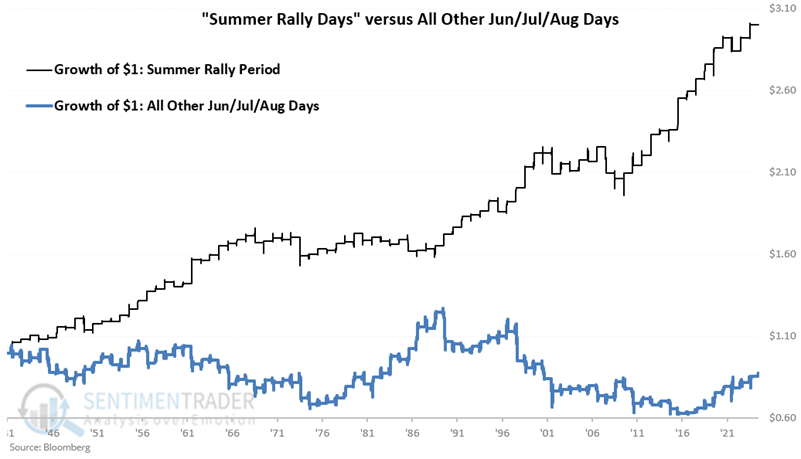
The chart below displays the cumulative percentage price change for the S&P 500 Index starting in 1942.
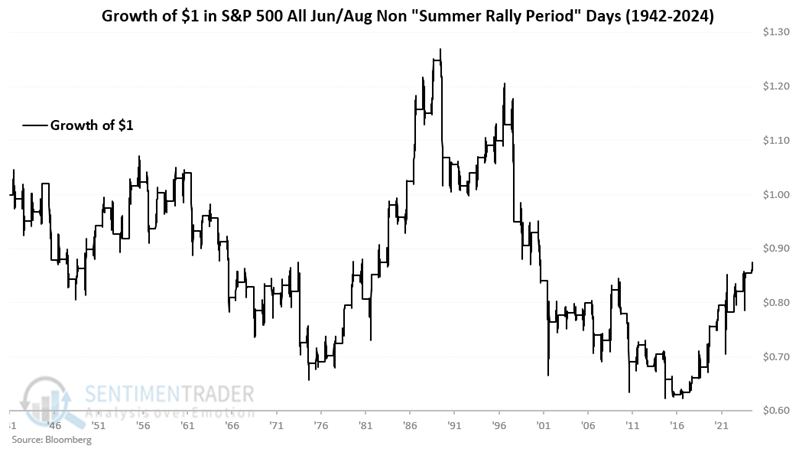
The chart below displays the cumulative percentage price change for the S&P 500 Index during "All Other Summer Days" (i.e., all June through August trading days, not including the nine days highlighted above).
The chart below combines the two above to emphasize the difference in performance during the twelve "favorable" day period versus all other trading days in June through August.
Summarizing summer results
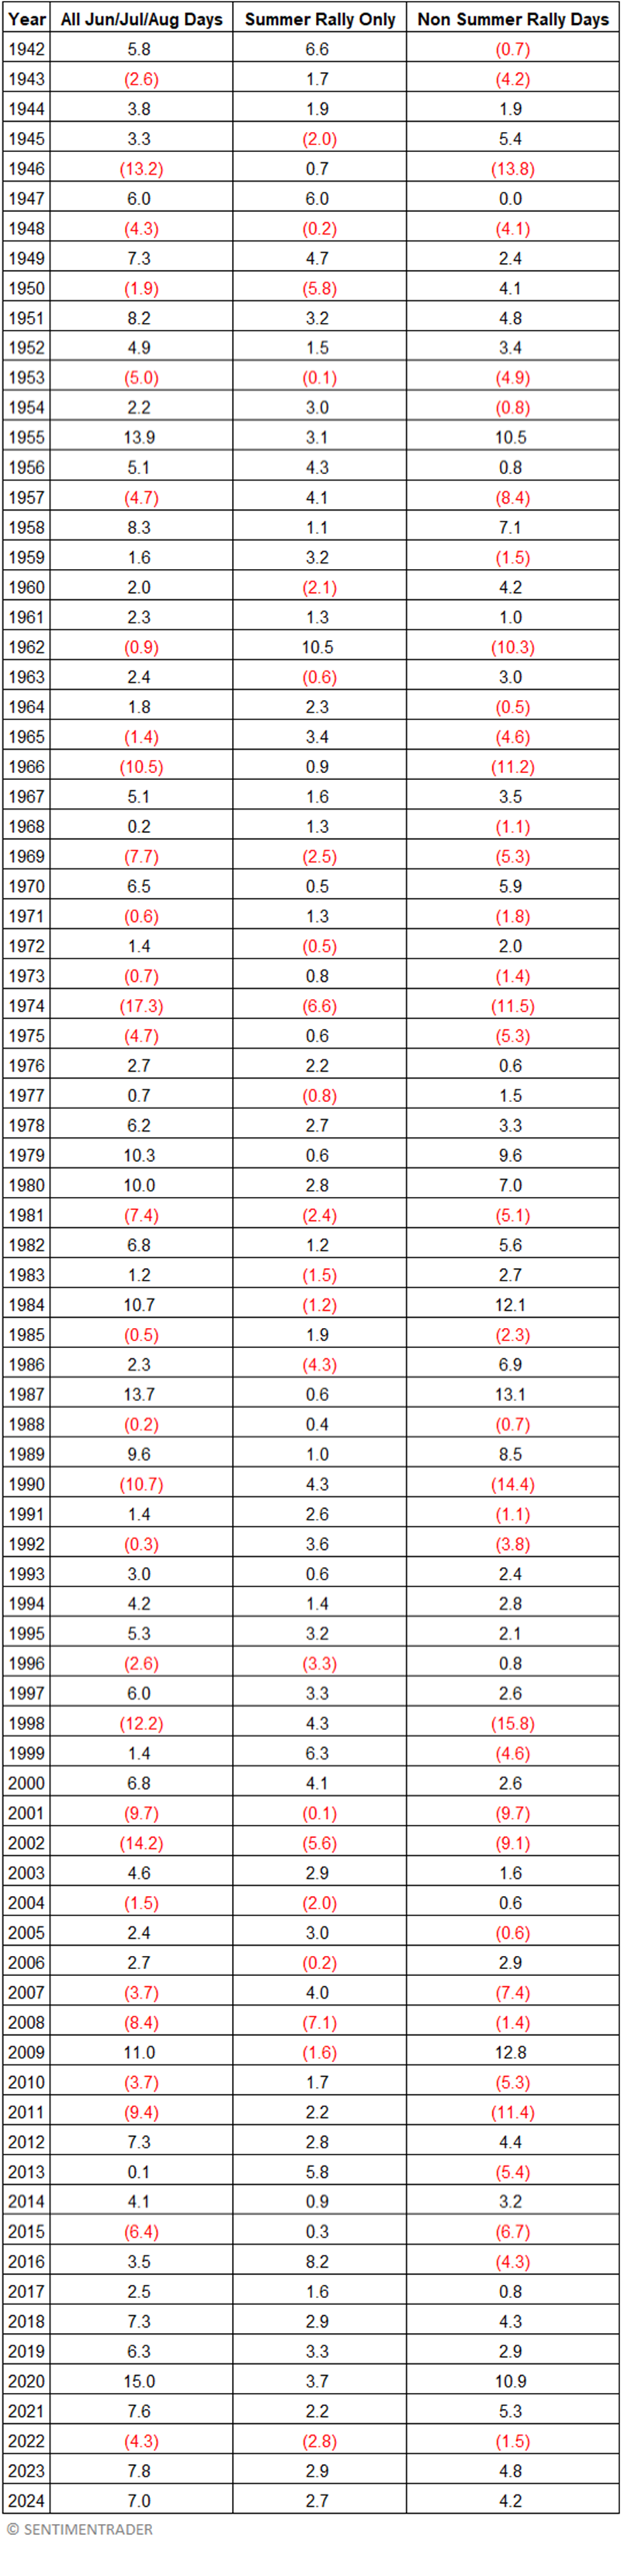
The table below displays the year-by-year performance for:
- June, July, and August together
- The Summer Rally Period alone
- All summer days other than the Summer Rally Period
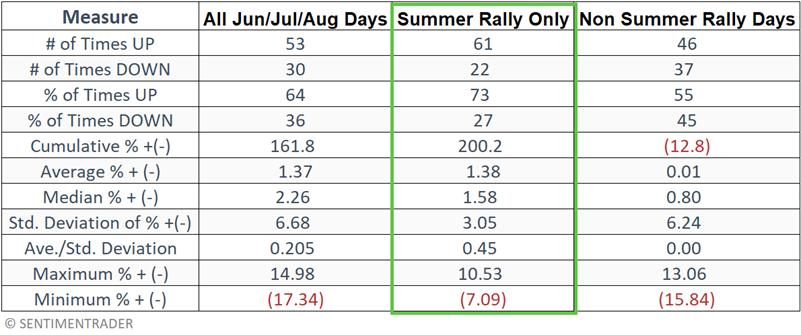
 The table below summarizes S&P 500 performance.
What the research tells us
The problem with seasonality is always the same - there is no guarantee that a given seasonal trend will work as expected in any given year. That said, the three "summer months" have statistically underperformed over the long term, and the twelve-day Summer Rally period has statistically outperformed. In the long run, investors have benefited from giving the bullish case the benefit of the doubt during the Summer Rally period.