Products
SentimenTrader Trading Tools
‍
Backtest Engine
My Trading Toolkit
Correlation Analysis
Seasonality
Market Prediction
Indicators & Data API
‍
Proprietary Indicators & Charts
Market Data API
Strategies & Scanner
‍
50+ Trading Strategies
Smart Stock Scanner
Smart Option Scanner
Research Reports
‍
Research Solutions
Reports Library
Free Resources
Simple Backtest Calculator
Simple Seasonality Calculator
The Kelly Criterion Calculator
Sentiment Geo Map
Public Research Reports
Education
Sentiment Indicators
Technical Indicators
Pricing
Company
About
In the News
Testimonials
Client Success Stories
Contact
Log inLoginSign up
< BACK TO ALL REPORTS

Record setting win streaks for the S&P 500 and Nasdaq Composite

Dean Christians
2024-07-11
The S&P 500 and Nasdaq Composite have registered gains in 10 of the past 11 trading sessions and recorded numerous all-time highs. Comparable win streaks tended to result in a buyer's strike, with both indexes consolidating at some point over the subsequent three months.

Key points:

  • The S&P 500 and the Nasdaq Composite have notched multiple record highs and impressive win streaks
  • Similar price patterns led to additional near-term gains for the Nasdaq and a pause for the S&P 500

Can the Fear of Missing Out (FOMO) momentum continue following rare win streaks?

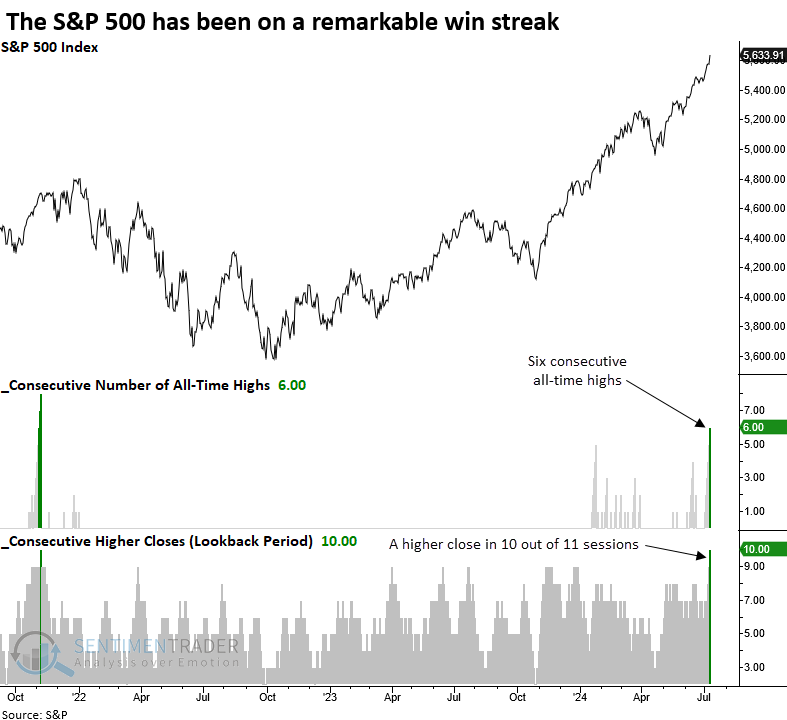
The S&P 500 has registered gains in 10 of the past 11 trading sessions, reaching an all-time high for six consecutive days through the close on Wednesday, a rare occurrence achieved only 12 other times in history.

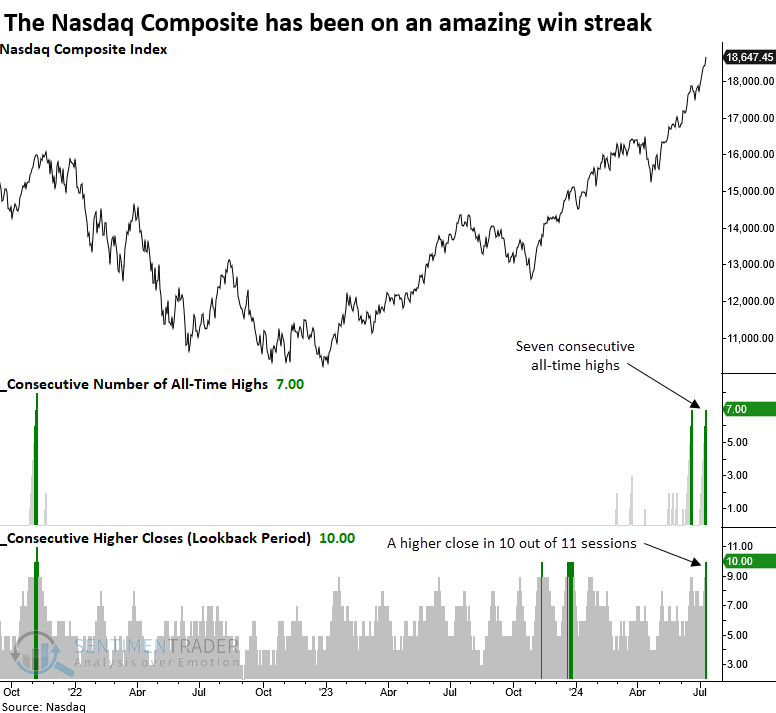
Demonstrating similar price momentum strength, the Nasdaq Composite closed higher in 10 of the last 11 sessions and achieved seven successive record highs, a rare event that has happened 11 other times since 1971.

If you're familiar with market history, you'll know that stock indexes seldom reach a long-term peak when price momentum is positive, as it is currently. However, in the near term, it can represent buyer's fatigue, leading to a pause that rejuvenates the bullish trend. 

Comparable win streaks preceded a near-term pause 

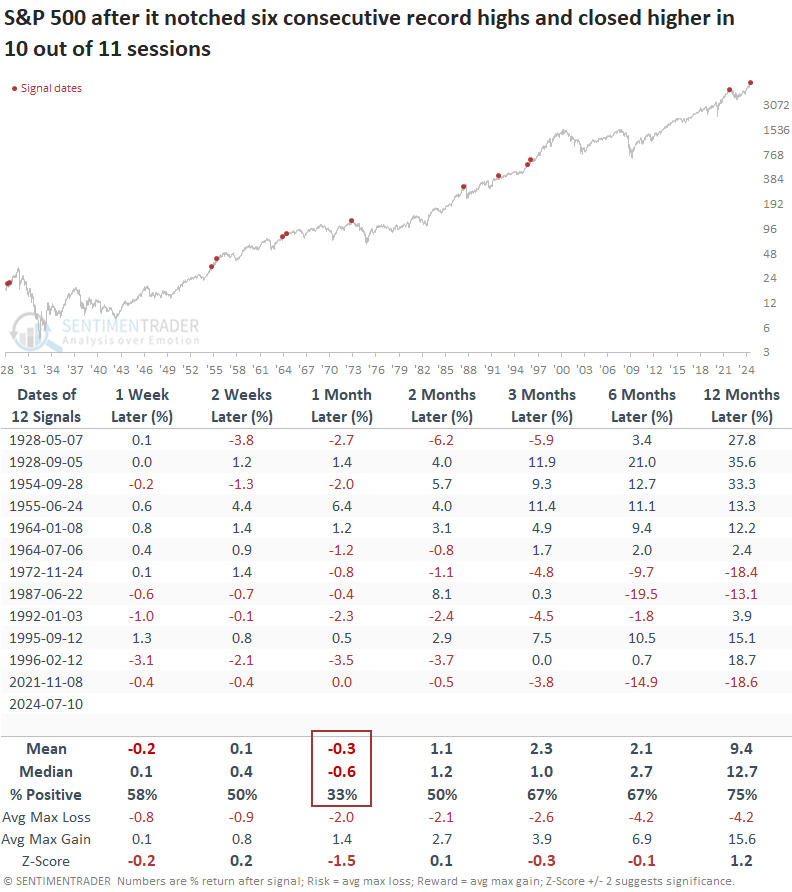
Following similar win streaks, the world's most benchmarked index tended to show signs of exhaustion in the near term. Over the next month, the index declined 67% of the time, with the median maximum loss exceeding the maximum gain. Still, a year later, the S&P 500 was higher in 75% of the precedents, suggesting a buyer's exhaustion pause that refreshed a bullish trend.

While the most recent instance in November 2021 could lead bears to yell "fire" in the theater, it's essential to recognize that the Fed was nearing a tightening phase then, which isn't the situation today. 

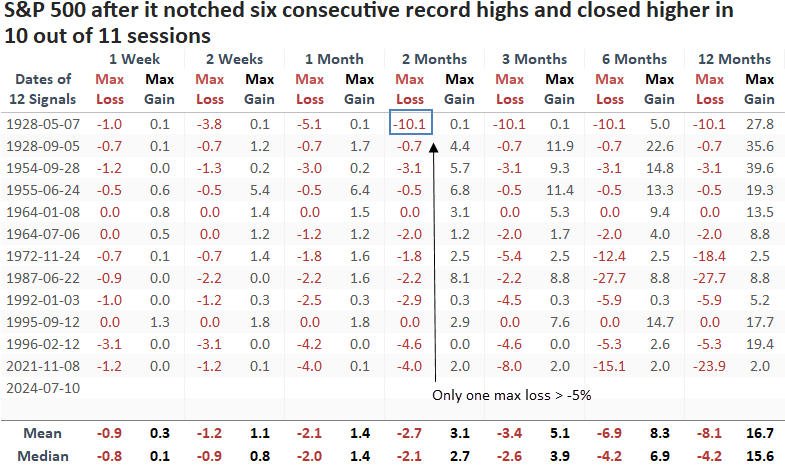
Over the subsequent two months, the S&P 500 experienced just one maximum loss exceeding -5%, which occurred in 1928. 

Therefore, should a consolidation develop, it's likely to be shallow.

One potential analog

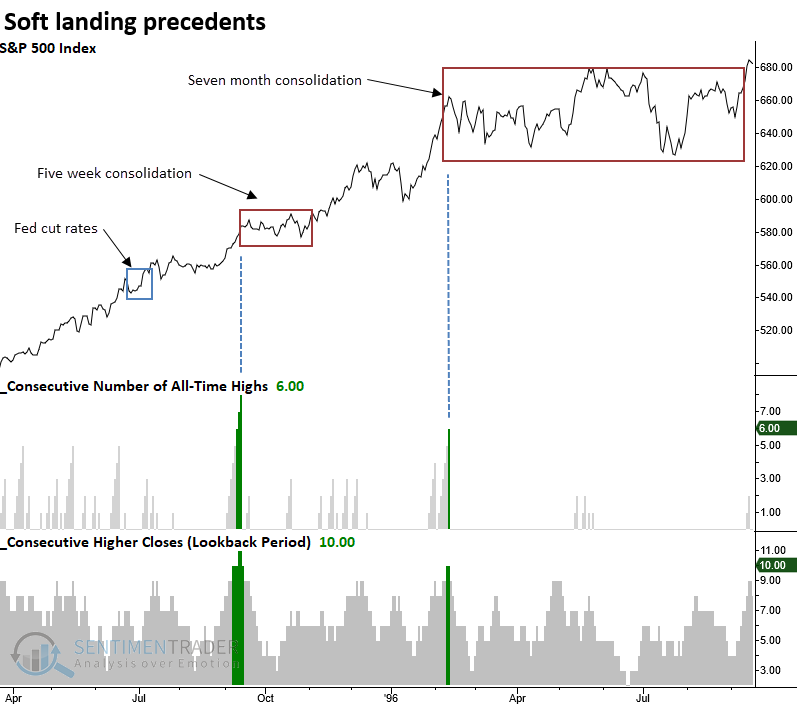
Whether the Fed can engineer a soft landing remains to be seen. If you're in that camp, the win streak precedents in 1995 and 1996 produced consolidations within an overall bullish trend.

An even more impressive win streak from the Nasdaq Composite

Not to be outdone, the Nasdaq Composite recorded seven straight all-time highs as it closed up in 10 out of 11 sessions.

Comparable win streaks preceded additional near-term upside followed by a pause

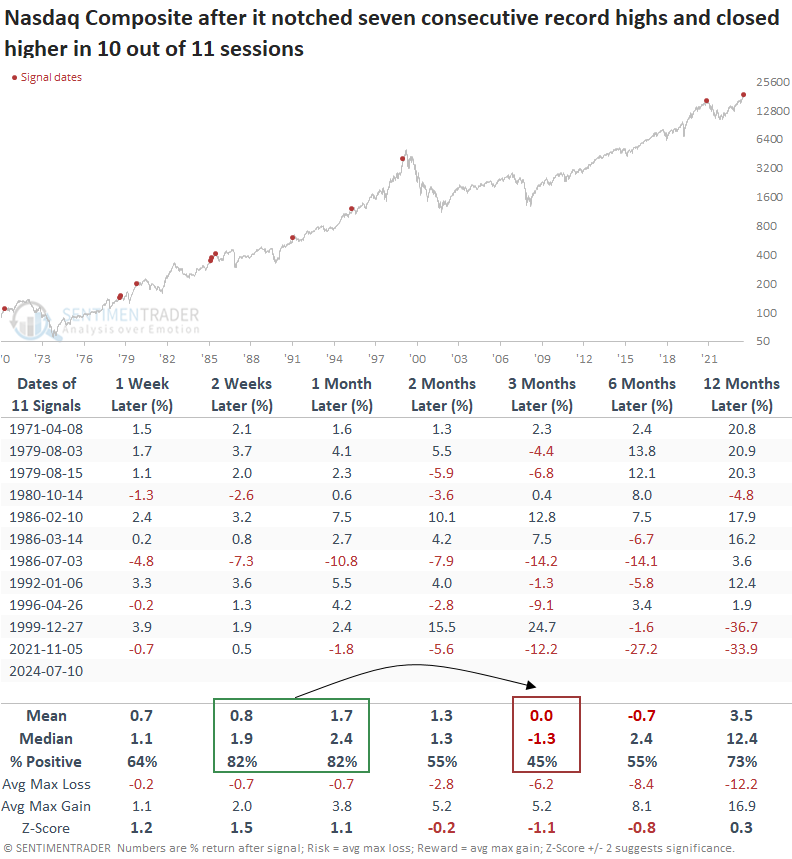
Following similar win streaks for the Nasdaq Composite, the favorable price momentum tended to persist over the next month, with the index rising 82% of the time. However, the upward trajectory waned three months later, with a negative median return and a less-than-coin-toss win rate. 

Like the S&P 500, the Nasdaq Composite reestablished its uptrend, rising 73% of the time a year later.  

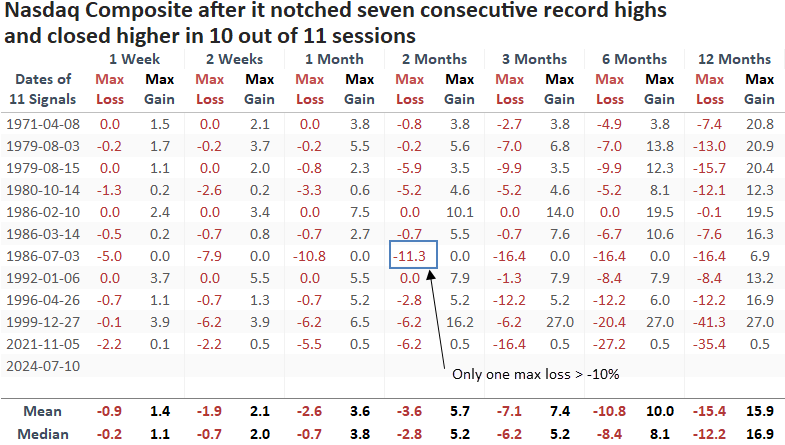
The maximum gain/loss table shows that the Nasdaq Composite experienced only one loss that was more significant than -10% over the following two months.

What the research tells us...

The S&P 500 and the Nasdaq Composite have exhibited impressive short-term win streaks while recording numerous all-time highs. Following similar patterns, both indexes suffered from buyer's exhaustion, leading to a consolidation at some point over the next three months. Should some turbulence develop, history suggests it's a pause that refreshes a bullish trend. 

PRODUCTS
SentimenTrader
Trading Tools
Indicators & Data API
‍
Strategies & Scanner
‍
Research Reports
FREE
RESOUrCES
Simple Backtest
Calculator
Simple Seasonality
Calculator
The Kelly Criterion
Calculator
Sentiment Geo Map
‍
Public Research Reports
‍
Education
Sentiment Indicators
‍
Technical Indicators
‍
Pricing
Bundle pricing
‍
FAQ
‍
Announcements
‍
COMPANY
‍
About
‍
In the News
‍
Testimonials
‍
Client Success Stories
CONTACT
‍
General Inquiries
‍
Media Inquiries
‍
Financial Professionals Inquiries
‍
© 2026 Sundial Capital Research Inc. All rights reserved.
Setsail Marketing
TermsPrivacyAffiliate Program
Risk Disclosure: The information and tools provided are for research and analytical purposes only and are not intended as investment advice. Market analysis involves uncertainty, and outcomes may differ from expectations. Users should conduct their own due diligence and consider their individual circumstances before making any financial decisions. Past performance is not necessarily indicative of future results.

Hypothetical Performance Disclosure: Hypothetical performance results have many inherent limitations, some of which are described below. No representation is being made that any account will or is likely to achieve profits or losses similar to those shown; in fact, there are frequently sharp differences between hypothetical performance results and the actual results subsequently achieved by any particular trading program. One of the limitations of hypothetical performance results is that they are generally prepared with the benefit of hindsight. In addition, hypothetical trading does not involve financial risk, and no hypothetical trading record can completely account for the impact of financial risk of actual trading. for example, the ability to withstand losses or to adhere to a particular trading program in spite of trading losses are material points which can also adversely affect actual trading results. There are numerous other factors related to the markets in general or to the implementation of any specific trading program which cannot be fully accounted for in the preparation of hypothetical performance results and all which can adversely affect trading results.

Testimonial Disclosure: Testimonials appearing on this website may not be representative of other clients or customers and is not a guarantee of future performance or success.