Products
SentimenTrader Trading Tools
‍
Backtest Engine
My Trading Toolkit
Correlation Analysis
Seasonality
Market Prediction
Indicators & Data API
‍
Proprietary Indicators & Charts
Market Data API
Strategies & Scanner
‍
50+ Trading Strategies
Smart Stock Scanner
Smart Option Scanner
Research Reports
‍
Research Solutions
Reports Library
Free Resources
Simple Backtest Calculator
Simple Seasonality Calculator
The Kelly Criterion Calculator
Sentiment Geo Map
Public Research Reports
Education
Sentiment Indicators
Technical Indicators
Pricing
Company
About
In the News
Testimonials
Client Success Stories
Contact
Log inLoginSign up
< BACK TO ALL REPORTS

Record highs for cyclical sectors bodes well for the broad market advance

Dean Christians
2024-11-08
For only the 22nd time since 1958, the discretionary, financial, industrial, and technology sectors closed at record highs within a week of each other. Similar breakout scenarios for cyclical sectors saw the S&P 500 rally 86% of the time over the subsequent year.

Key points:

  • The discretionary, financial, industrial, and technology sectors closed at record highs within the last week
  • Similar cyclical sector breakouts produced an 86% win rate for the S&P 500 a year later
  • Growth-oriented sectors like discretionary and technology outperformed the S&P 500 

Cyclical sectors suggest the uptrend in stocks persists

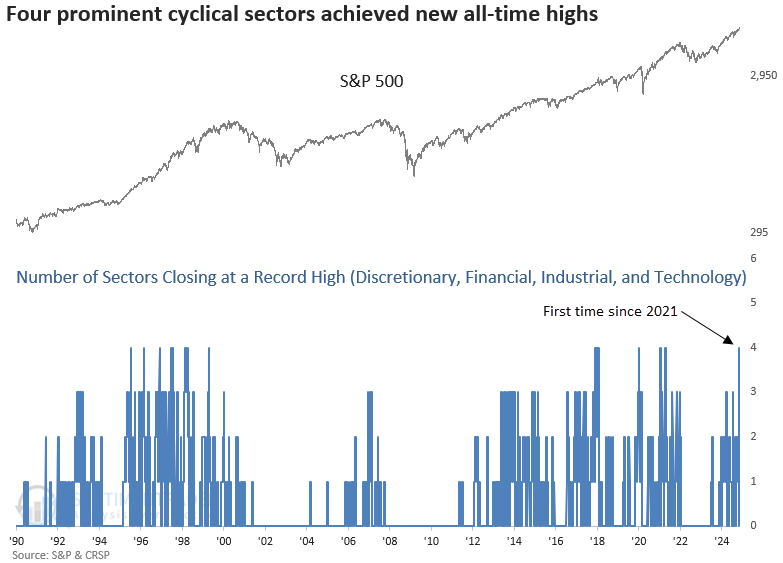
In a remarkable development, the consumer discretionary, financial, industrial, and technology sectors reached new record highs over the last week, marking the first coordinated breakout since 2021. 

This synchronized advance among cyclical sectors signals a bullish alignment between indexes (external price trends) and individual stocks (internal price trends), as detailed in my report "Cyclical Stocks Dominate the New Highs List."

I applied two resets to filter out repeats: the first reset required the sector count to drop to zero, and the second identified the first signal in two months. 

Comparable breakouts preceded positive returns for the S&P 500

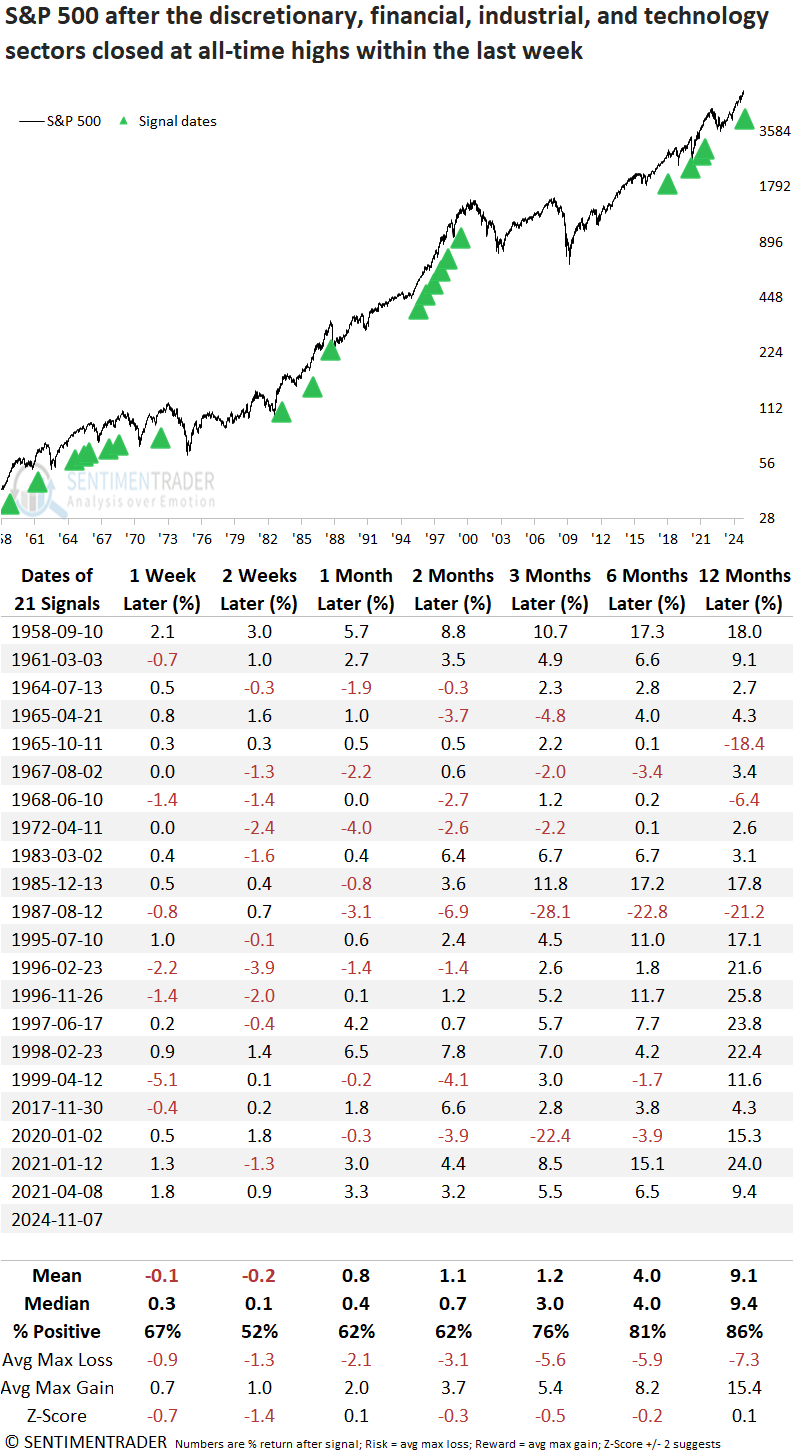
Whenever the discretionary, financial, industrial, and technology sectors recorded all-time highs within one week of each other, the S&P 500 rallied 86% of the time over the subsequent year, with no losses since 1987.

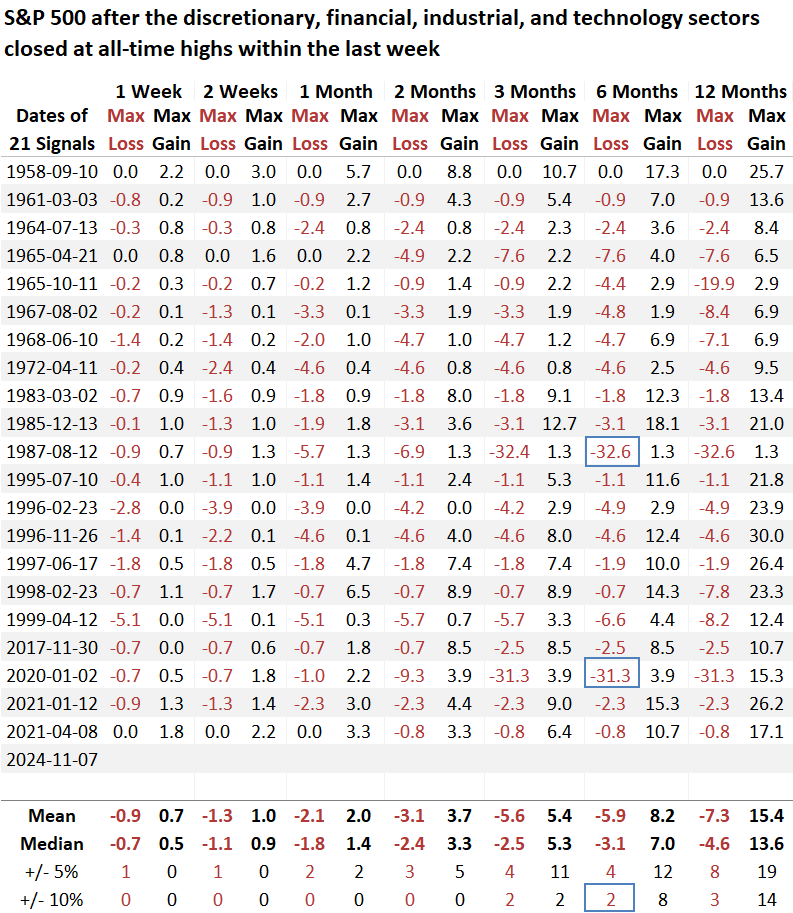
From one week to two months later, returns generally underperformed historical averages. Furthermore, the average maximum loss exceeded the maximum gain in three out of four horizons, and z-scores were uninspiring.

The bottom line is that while stocks should advance over the next year, the pace could slow in the near term.

Over the following six months, the S&P 500 experienced just two maximum losses exceeding 10%, each tied to extraordinary events, including the 1987 crash and the Covid outbreak. 

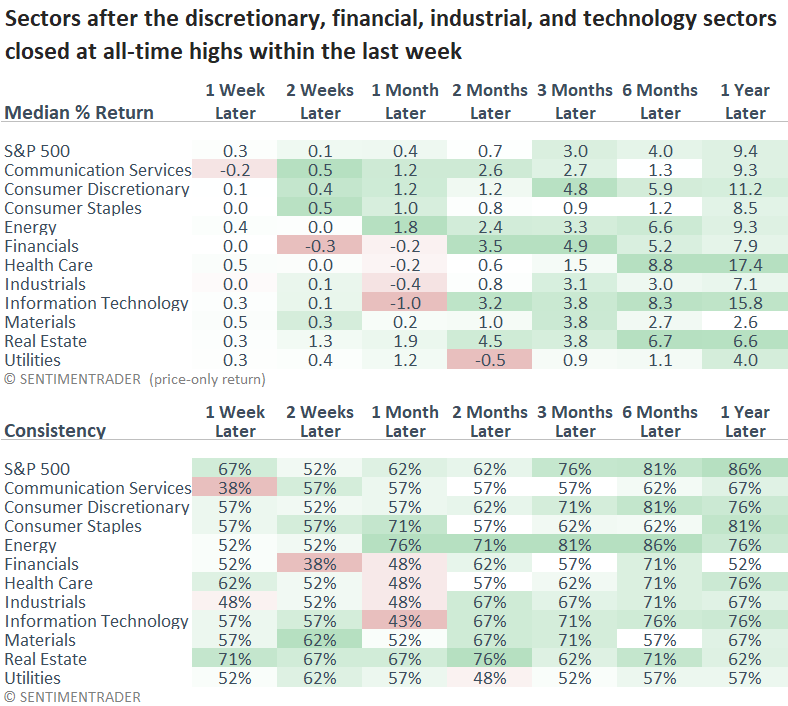
Growth-oriented sectors surpassed the S&P 500, with consumer discretionary and technology sectors demonstrating the most consistent outperformance from two to twelve months later. 

Current trends

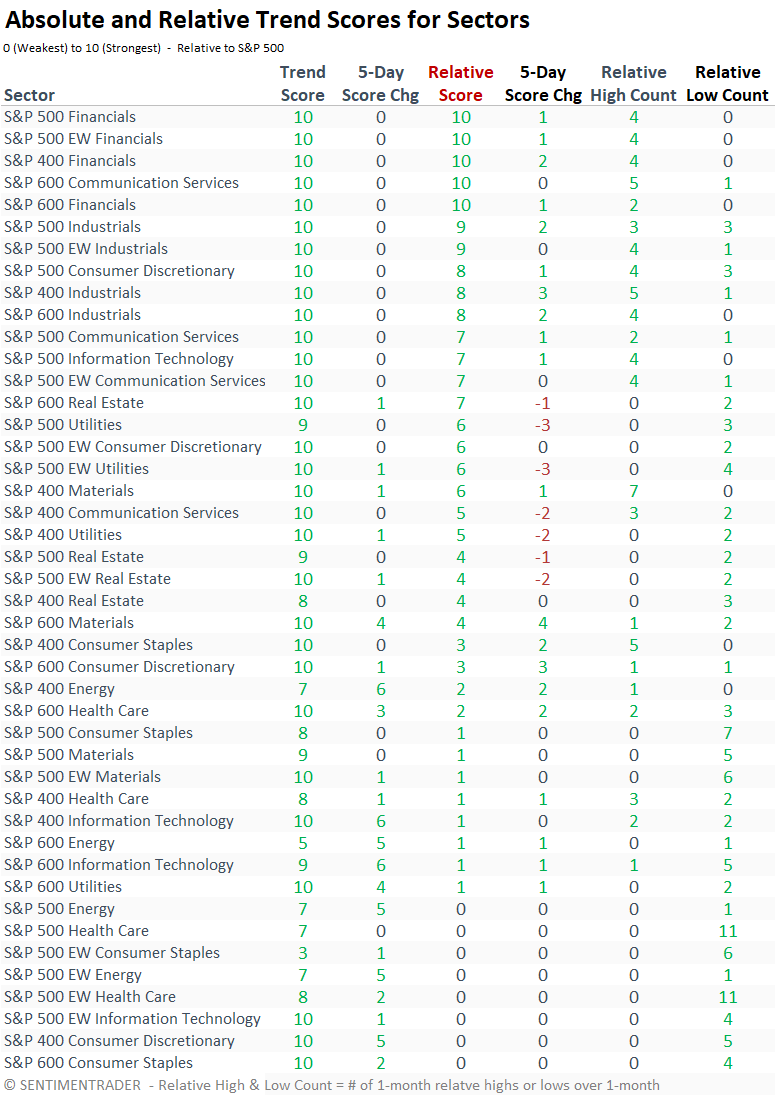
Financials across large, mid, and small-cap stocks lead the relative trend score rankings, closely followed by industrials, while consumer discretionary and technology sectors show strength primarily in large-cap stocks. 

What the research tells us...

The record highs achieved over the last week by the discretionary, financial, industrial, and technology sectors-cyclical groups sensitive to economic conditions-represents a bullish development for the broader market. These sectors, which are typically driven by consumer spending, business investment, and innovation suggests that investor confidence in the economy remains resilent, reinforcing the notion that the uptrend in the market is likely to persist.

PRODUCTS
SentimenTrader
Trading Tools
Indicators & Data API
‍
Strategies & Scanner
‍
Research Reports
FREE
RESOUrCES
Simple Backtest
Calculator
Simple Seasonality
Calculator
The Kelly Criterion
Calculator
Sentiment Geo Map
‍
Public Research Reports
‍
Education
Sentiment Indicators
‍
Technical Indicators
‍
Pricing
Bundle pricing
‍
FAQ
‍
Announcements
‍
COMPANY
‍
About
‍
In the News
‍
Testimonials
‍
Client Success Stories
CONTACT
‍
General Inquiries
‍
Media Inquiries
‍
Financial Professionals Inquiries
‍
© 2026 Sundial Capital Research Inc. All rights reserved.
Setsail Marketing
TermsPrivacyAffiliate Program
Risk Disclosure: The information and tools provided are for research and analytical purposes only and are not intended as investment advice. Market analysis involves uncertainty, and outcomes may differ from expectations. Users should conduct their own due diligence and consider their individual circumstances before making any financial decisions. Past performance is not necessarily indicative of future results.

Hypothetical Performance Disclosure: Hypothetical performance results have many inherent limitations, some of which are described below. No representation is being made that any account will or is likely to achieve profits or losses similar to those shown; in fact, there are frequently sharp differences between hypothetical performance results and the actual results subsequently achieved by any particular trading program. One of the limitations of hypothetical performance results is that they are generally prepared with the benefit of hindsight. In addition, hypothetical trading does not involve financial risk, and no hypothetical trading record can completely account for the impact of financial risk of actual trading. for example, the ability to withstand losses or to adhere to a particular trading program in spite of trading losses are material points which can also adversely affect actual trading results. There are numerous other factors related to the markets in general or to the implementation of any specific trading program which cannot be fully accounted for in the preparation of hypothetical performance results and all which can adversely affect trading results.

Testimonial Disclosure: Testimonials appearing on this website may not be representative of other clients or customers and is not a guarantee of future performance or success.