Products
SentimenTrader Trading Tools
‍
Backtest Engine
My Trading Toolkit
Correlation Analysis
Seasonality
Market Prediction
Indicators & Data API
‍
Proprietary Indicators & Charts
Market Data API
Strategies & Scanner
‍
50+ Trading Strategies
Smart Stock Scanner
Smart Option Scanner
Research Reports
‍
Research Solutions
Reports Library
Free Resources
Simple Backtest Calculator
Simple Seasonality Calculator
The Kelly Criterion Calculator
Sentiment Geo Map
Public Research Reports
Education
Sentiment Indicators
Technical Indicators
Pricing
Company
About
In the News
Testimonials
Client Success Stories
Contact
Log inLoginSign up
< BACK TO ALL REPORTS

Rays of Hope from Some Put/Call Ratio Extremes

Jay Kaeppel
2026-04-07
Recent extreme readings from several sensitive put/call indicators offer hope that the worst could be behind us. That said, these indicators are best viewed as "clues" and not automatic "buy" signals. Details herein.

Key points:

  • Put/Call data can serve as a useful weight of the evidence tool when it reaches an extreme
  • Extreme readings in put/call data offer a window into the minds of speculative traders - who often act based on emotion, and therefore tend to be wrong when they swing heavily in one direction or the other
  • The OEX Put/Call Ratio and ROBO Put Call Ratio flashed favorable weight of the evidence signals during the recent market sell-off

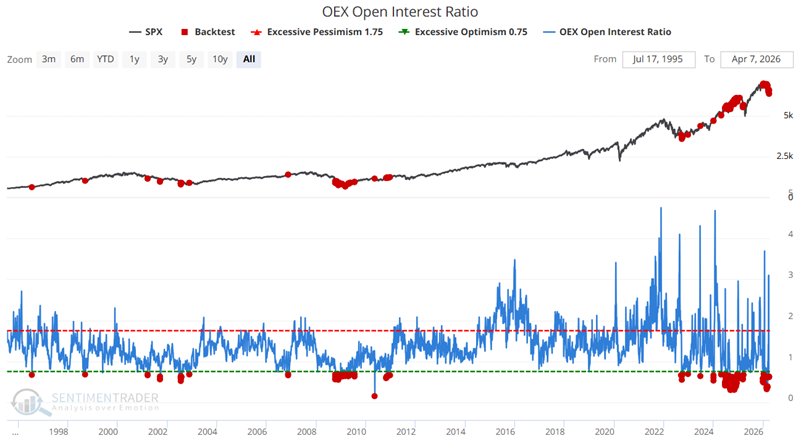
The OEX Open Interest Ratio recently plunged

OEX is shorthand for the S&P 100, an index made up of the 100 largest companies in the S&P 500. Open interest is the total number of outstanding option contracts. Open interest increases with opening transactions and decreases with closing transactions. Someone buying a call to open (a bullish position) would increase open interest by one, and someone selling a call to open (a bearish position) would also increase open interest by one. The open interest indicator divides the total put open interest by the total call open interest. As more put contracts are opened (and/or call contracts are closed), the indicator rises; as put contracts are closed (and/or call contracts are opened), the indicator falls.

I view this indicator as a "weight of the evidence" tool rather than a trading signal generator. The chart below highlights all dates when the indicator value

Sorry, you don't have access to this report

Upgrade your subscription plan to get access
Go to Dasboard
PRODUCTS
SentimenTrader
Trading Tools
Indicators & Data API
‍
Strategies & Scanner
‍
Research Reports
FREE
RESOUrCES
Simple Backtest
Calculator
Simple Seasonality
Calculator
The Kelly Criterion
Calculator
Sentiment Geo Map
‍
Public Research Reports
‍
Education
Sentiment Indicators
‍
Technical Indicators
‍
Pricing
Bundle pricing
‍
FAQ
‍
Announcements
‍
COMPANY
‍
About
‍
In the News
‍
Testimonials
‍
Client Success Stories
CONTACT
‍
General Inquiries
‍
Media Inquiries
‍
Financial Professionals Inquiries
‍
© 2026 Sundial Capital Research Inc. All rights reserved.
Setsail Marketing
TermsPrivacyAffiliate Program
Risk Disclosure: The information and tools provided are for research and analytical purposes only and are not intended as investment advice. Market analysis involves uncertainty, and outcomes may differ from expectations. Users should conduct their own due diligence and consider their individual circumstances before making any financial decisions. Past performance is not necessarily indicative of future results.

Hypothetical Performance Disclosure: Hypothetical performance results have many inherent limitations, some of which are described below. No representation is being made that any account will or is likely to achieve profits or losses similar to those shown; in fact, there are frequently sharp differences between hypothetical performance results and the actual results subsequently achieved by any particular trading program. One of the limitations of hypothetical performance results is that they are generally prepared with the benefit of hindsight. In addition, hypothetical trading does not involve financial risk, and no hypothetical trading record can completely account for the impact of financial risk of actual trading. for example, the ability to withstand losses or to adhere to a particular trading program in spite of trading losses are material points which can also adversely affect actual trading results. There are numerous other factors related to the markets in general or to the implementation of any specific trading program which cannot be fully accounted for in the preparation of hypothetical performance results and all which can adversely affect trading results.

Testimonial Disclosure: Testimonials appearing on this website may not be representative of other clients or customers and is not a guarantee of future performance or success.