Rare Signal for the Percentage of Members Outperforming the S&P 500 Index

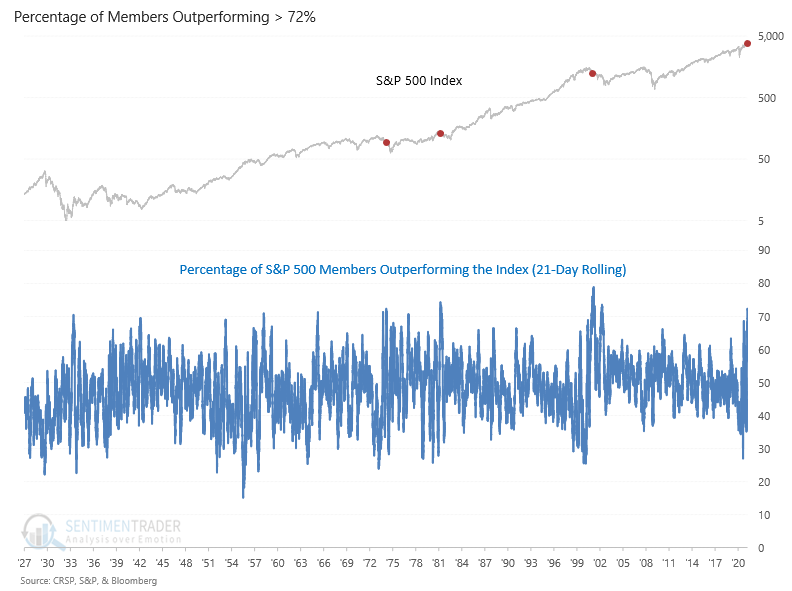
Jason and I have shared several studies in the last few weeks that have highlighted the market rotation between indexes and factors. We can add the following item to the growing list. For only the 4th time in history, the percentage of S&P 500 members outperforming the Index over a rolling 21-day period crossed above 72%. Historically, a spike above this level occurs when the market capitalization for a sector or group of stocks (Nifty Fifty) grows to a position that dominates the Index. When the cap-weighted S&P 500 Index succumbs to selling pressure from the dominant group, the other index stocks outperform over the rolling 21-day period, and the indicator spikes to a high level.
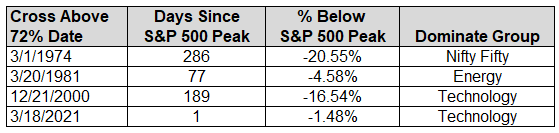
I created the following table to provide some context around the historical signals. Interestingly, all three prior instances occurred in bear markets and after the S&P 500 had suffered considerable damage in 2/3 cases. While the most recent rotation pushed the technology sector down almost 10% from the highs and several more speculative areas suffered more damage, the S&P 500 held up well with a decline of less than 5%. On the surface, the most recent technology-driven rotation does not look similar to the other historical instances. Therefore, I would not extrapolate some dire message as it relates to the broad market. For now, it looks like we had a good old fashion rotation versus the outright bursting of a bubble.
Percentage Outperforming Chart