
Quick hits - Treasuries, crude oil and technology stocks

Key Points
- Treasuries have been crushed in 2022, but are entering their most favorable time of year
- Crude oil and soared, but a reading from a key indicator overhangs the prospects of a continuation
- Technology stocks are getting dumped heavily - except, curiously - by the people who know these companies best
It may be soon or never for long-term treasuries
Since March 2020, bonds have been hit harder than anytime in the last 40 years. Ticker TLT recently reached a -33% decline from its peak. And there is no guarantee that the decline is close to being over. Long-term treasuries are the purest play on interest rates - the more rates rise, the further long-term treasuries fall. So as long as rates keep rising, bond prices will continue to fall.
Will the decline cool and reverse to the upside? That is impossible to predict. However, the seasonal trends for long-term treasuries are about to enter a "favorable" period. Does that mean a reversal is imminent? Sadly, no. No seasonal trend is ever guaranteed to work out "this time around." That said, history is replete with situations where a deeply oversold (or overbought) market reversed following the start of a significant new seasonal trend.
The chart below displays the annual seasonal trend for the thirty-year treasury bond futures.
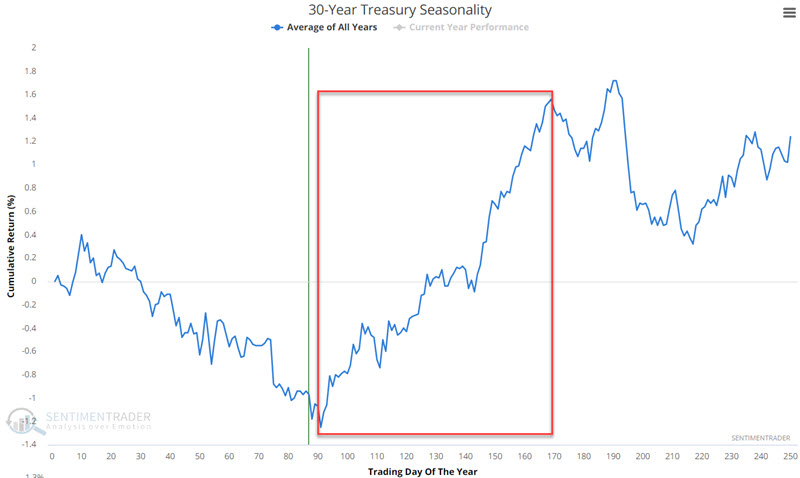
Traders who choose to play long-term treasuries but do not want to trade futures can utilize ticker TLT (20+ Year Treasury Bond iShares ETF).
Long-term treasuries are entering what is typically the most favorable time of year for long-term treasuries. This should not be interpreted as an automatic "buy" signal. The minimum takeaway: The worst may be over for bonds soon - at least for a while.
For my information on bonds see here, here and here.
The dark cloud overhanging crude oil
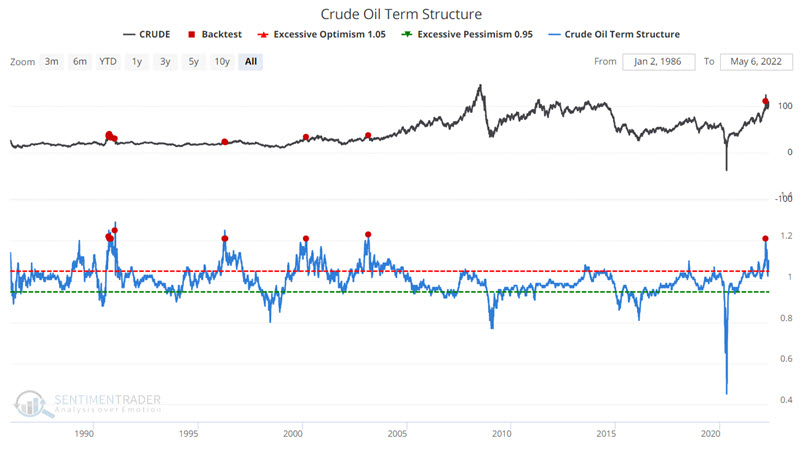
Energy prices have soared since April 2020 with a "spike" in March 2022. Since that it has chopped sideways. Will crude break out again to the upside? With turmoil in the world oil market, war in Ukraine and high inflation, it is certainly possible. But as I wrote about here, term structure in the crude oil futures market gave an important signal in early March and remains elevated. Results in the year following previous such readings have been decidedly negative.
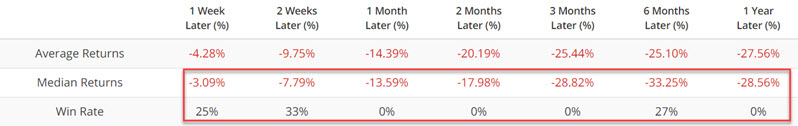
The chart below displays the results for crude oil futures following occasions when term structure spiked about 1.20.
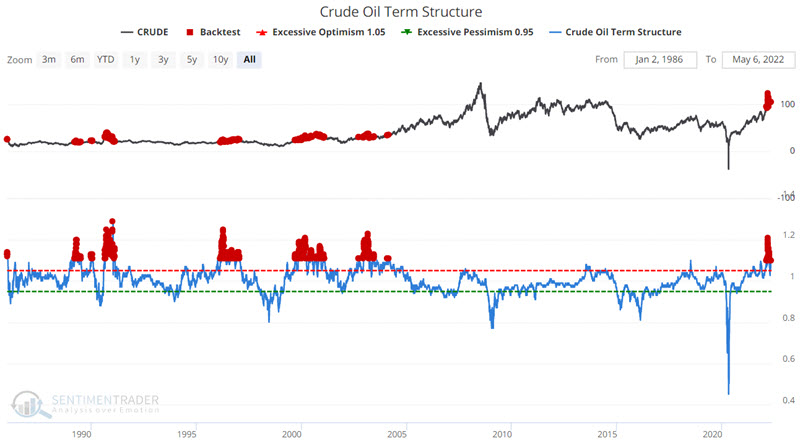
Even slightly less elevated readings have witnessed subpar readings. The chart and table below display all occasions when crude oil term structure was above 1.10.
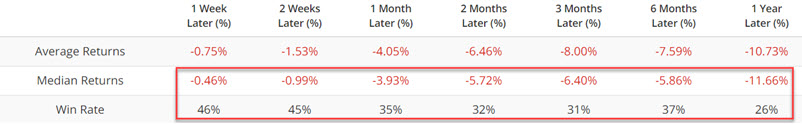
The key takeaway is simply not to fall in love with the uptrend in crude oil. History suggests a reversal will occur sometime in the next 12 months and that the decline may be severe.
The curious case of technology stocks
Technology stocks have taken a beating. Ticker XLK (Technology Sector Select SPDR ETF) is down over -20% from its peak and many, many individual tech stocks have lost -50% to -80% or more. Buying now would literally meet the definition of trying to "catch a falling safe."
The crazy thing is that tech company insiders have been using this decline to load up on their own shares. This does not imply a quick rebound. Nevertheless, heavy insider buying in a sector has historically been a very favorable sign for that sector going forward.
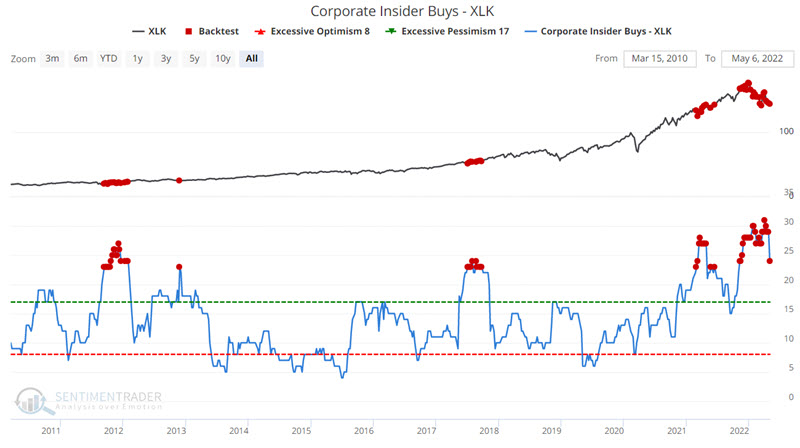
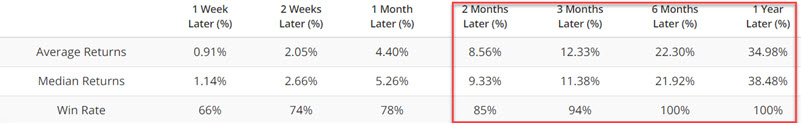
The chart and table below display the performance of XLK when insider buying has reached as elevated of a level as it has now.
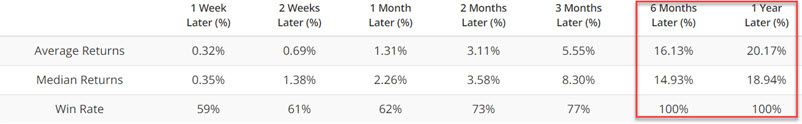
Likewise, when fear and doubt begin to creep in to a specific sector the correlations of the stock in the sector rise - as investors dump all stocks in the sector, regardless of fundamentals or valuation. The chart and table below display the performance of XLK following all readings as high as the current one.
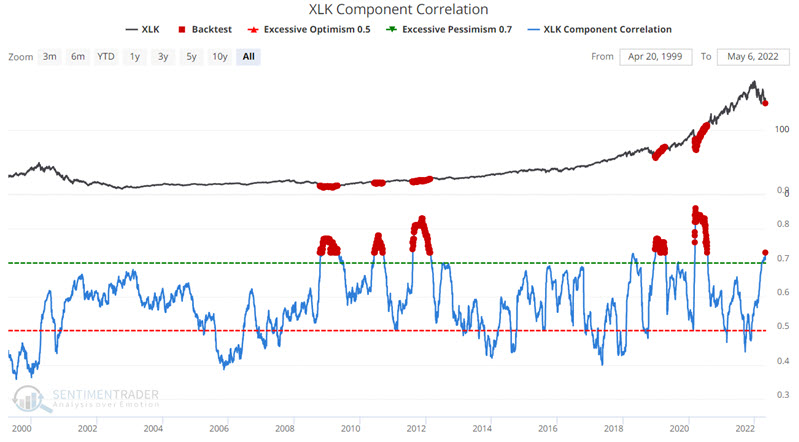
Technology stocks are getting dumped - except it would seem by the people who know best the prospects for these companies. That doesn't mean it is an ideal time to buy, but it does argue in favor of paying close attention in looking for a buying opportunity in this battered sector.
What the research tells us…
The purpose of "quick hits" is not necessarily to elicit a trade. Rather it is to alert you to unique trading opportunities that may be in the process of forming. Bonds and technology stocks have been in decisive downtrends. The evidence above suggests that at the very least those move may soon run out of steam - and if they do reverse they may do so decisively. The information regarding crude oil is simply intended to remind you to question the "conventional wisdom" that energy price are certain to trend sharply higher. An interim move higher is certainly possible, but history suggest a significant reversal in the 6-12 months ahead.