
Quick hits - SPY Breath gets even more oversold

Key Points
- Both the SPY Breath (50 Day Avg) and SPY Breath (200 Day Avg) indicators which were detailed in this article yesterday, fell even further in oversold territory
- This piece details historical results following readings at these more oversold levels
- Whether or not these indicators market "The Bottom" or not is open to intense debate; however, the readings suggest an oversold market that is due for a bounce
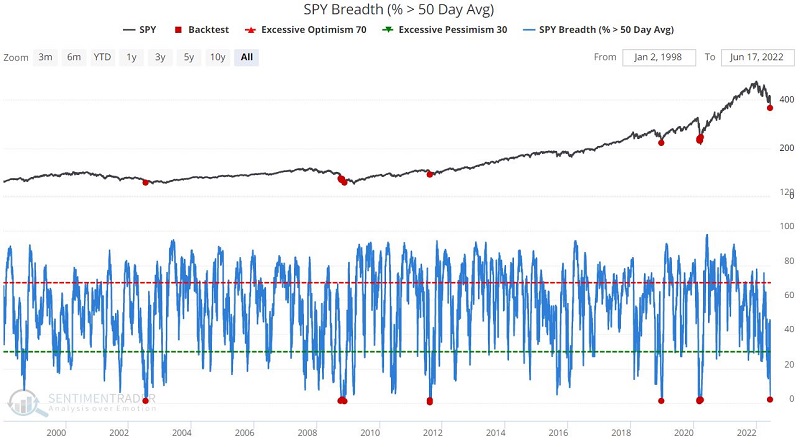
SPY Breadth (% > 50-day Avg)
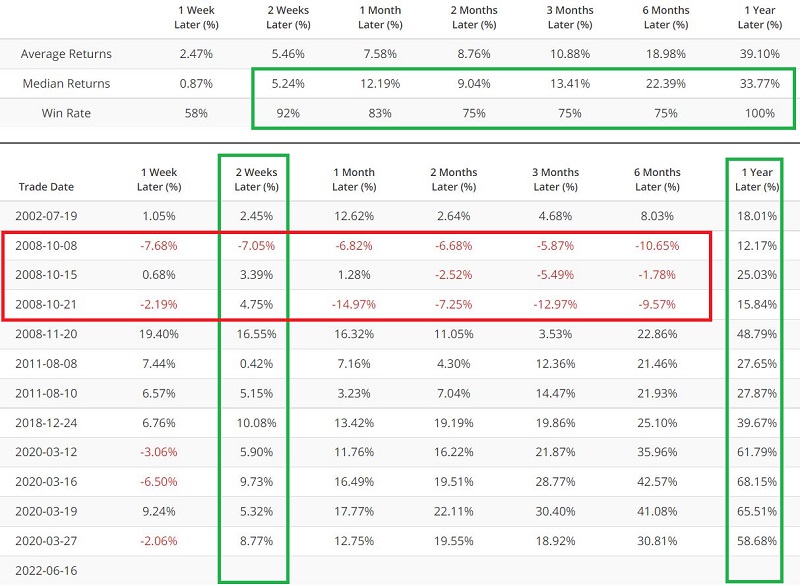
The chart below displays those times when the SPY Breadth (% > 50 Day Avg) indicator crossed below 2% (as it did on 6/16). The table shows a summary of SPY performance following each signal.
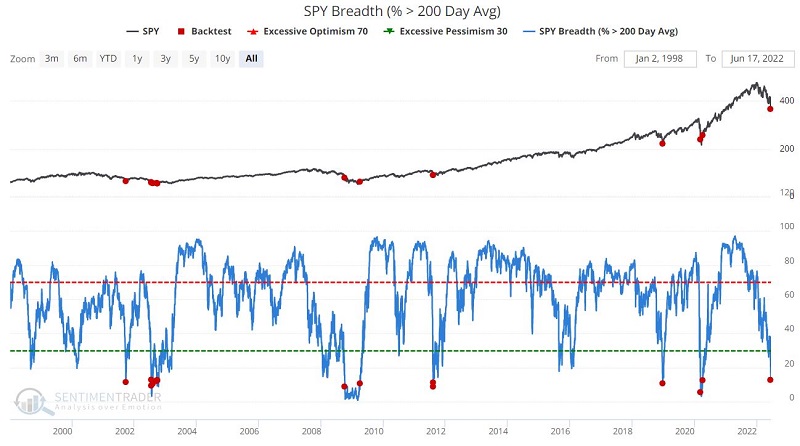
SPY Breath (% > 200 Avg)
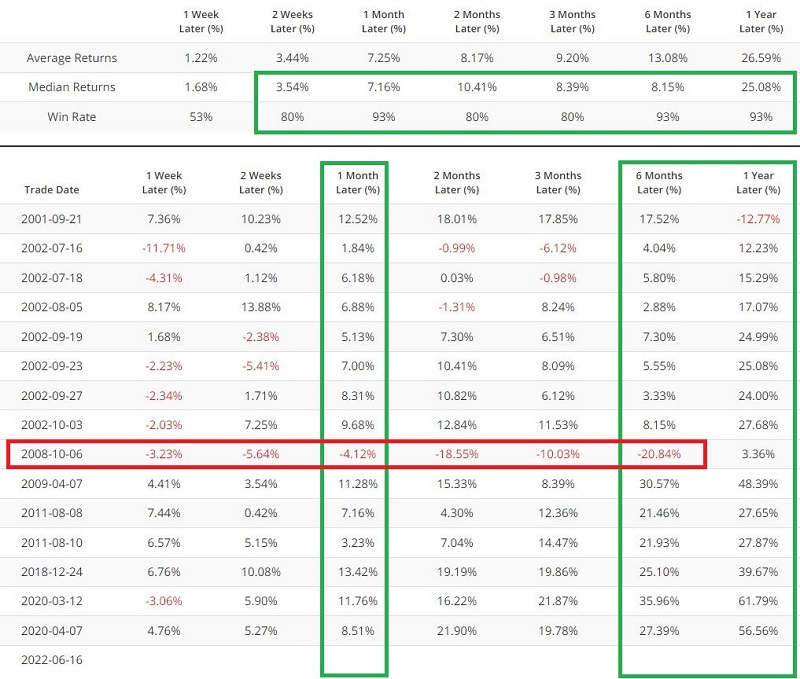
The chart below displays those times when the SPY Breadth (% > 200 Day Avg) indicator dropped below 13% (as it did on 6/16). The table shows a summary of SPY performance following a signal.
What the research tells us…
The big question is whether or not we are in a 2008-style bear market decline. In October of that year, both indicators above gave signals followed by a further plunge to the ultimate bear market low. Will the latest signals follow suit? Trend and seasonality are presently unfavorable, suggesting that that is a possibility. And one can argue whether or not we have yet to witness a true bear market bottom level of capitulation. Regardless, based on the overall performance of the indicator signals detailed above, both indicators must be moved to the "bullish" side of the ledger.