
Quick hits - SPY and natural gas

Key Points
- Our Medium-Term Risk Levels indicator for stocks has fallen to a favorable level, suggesting the potential for a rally in stocks.
- A particular option strategy is well suited for traders looking for a low dollar-risk play
- Natural gas rallied strongly into resistance - seasonality suggests that there is room for more potential upside, but Optix is at a level that suggests that traders do not fall in love with the current bullish trend (even as they may ride it higher)
Stocks - Medium-Term Risk Levels
Our Stocks - Medium-Term Risk Levels indicator just dropped to 1 again. The chart below displays the S&P 500 and all previous days when this indicator stood at a level of 1.
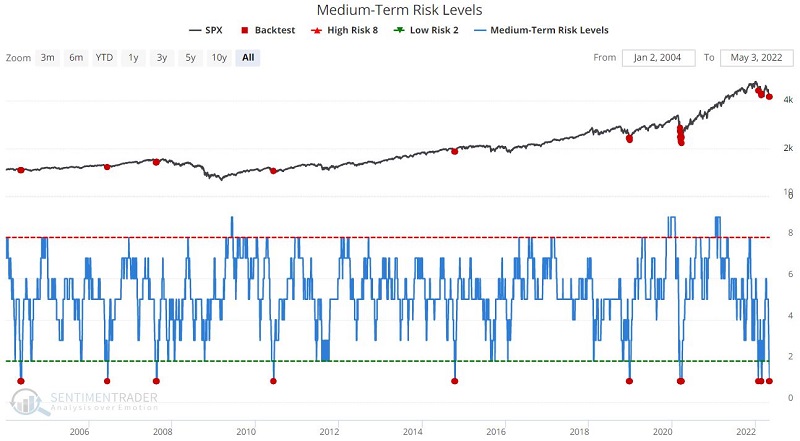
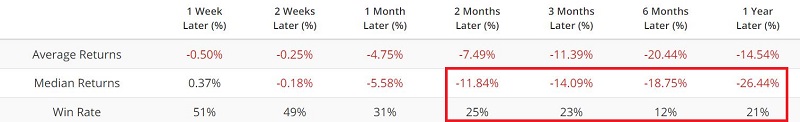
The table below displays a summary of the performance for the S&P 500 following previous signals.
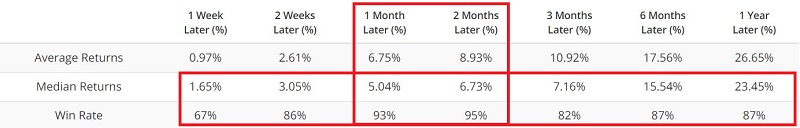
If history proves an accurate guide (and unfortunately, there is no guarantee that it will), the stock market could stage at least a decent bounce in the next 1-2 months.
The Out-of-the-money call butterfly
For a trader looking to play for a short-term (next 1-2 months) bounce in the stock market, the most straightforward approach would be buying SPY shares and placing a stop below the recent lows. Currently, the cost to buy 100 shares of SPY is $41,638. The recent low for SPY was $405.02 a share. So, if a trader places a stop-loss at, say, $404.52, the risk would be -$1,186 ($404.52 - $416.38 x 100 shares), or -2.8%.
A lower-cost alternative would be to:
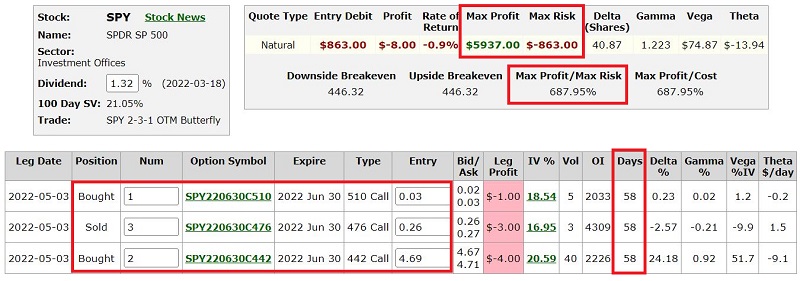
- Buy 2 SPY June30 442 calls @ $4.69
- Sell 3 SPY June30 476 calls @ $0.26
- Buy 1 SPY June30 510 calls @ $0.03
The particulars for this hypothetical position appear below (both figures below are courtesy of www.Optionsanalysis.com). The total cost to enter this trade - (based on getting filled at the midpoint of each option's bid/ask spreads) - and the maximum risk - is $863.
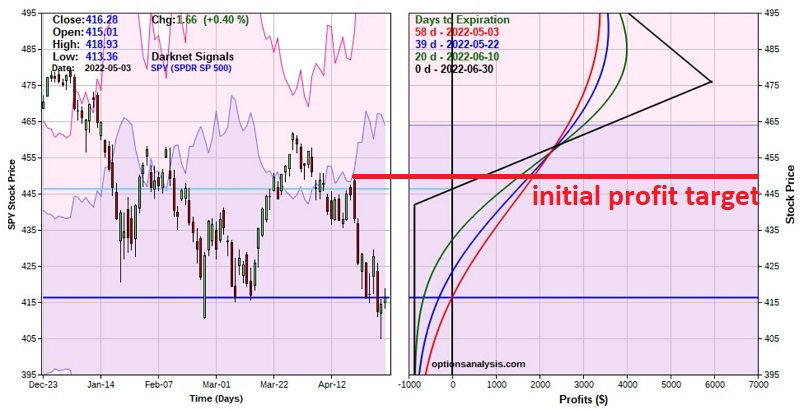
The chart below displays the "risk curves" for this position. Each colored line on the right-hand side shows the expected $ profit or loss based on the price of SPY shares.
Things to note:
- If we set an arbitrary profit target of $450 a share for SPY and that price is reached, the profit on this position would be roughly $1,800 (if reached immediately) to $800 (if not reached until option expiration day on 6/30).
- An alternative would be to buy more than a 1-lot and sell half if $450 a share for SPY is reached and let the remaining position ride
- On the upside, time decay works against this trade with SPY below roughly $458 (i.e., each colored line shows progressively less profit or greater loss as time progresses)
- If SPY trades above $458, time decay helps this position (i.e., each colored line shows progressively less profit or greater loss as time progresses)
- On the downside, if SPY drops below $405, the loss is between -$410 and -$863, depending on how quickly it is hit
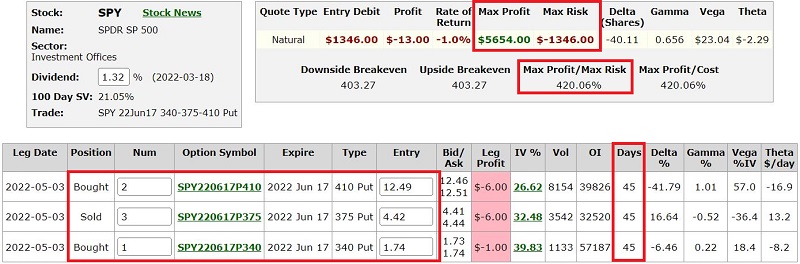
On the other end of the spectrum, for a trader who believes that the recent low for SPY WILL NOT hold, a possible option trade involves:
- Buying 2 SPY June17 410 puts @ $12.49
- Selling 3 SPY June17 375 puts @ $4.42
- Buying 1 SPY June17 340 puts @ $1.74
The particulars for this hypothetical position appear below. The maximum risk on this trade (based on getting filled at the midpoint of each option's bid/ask spreads) is $1,346 for a 1-lot.
The chart below displays the "risk curves" for this position.
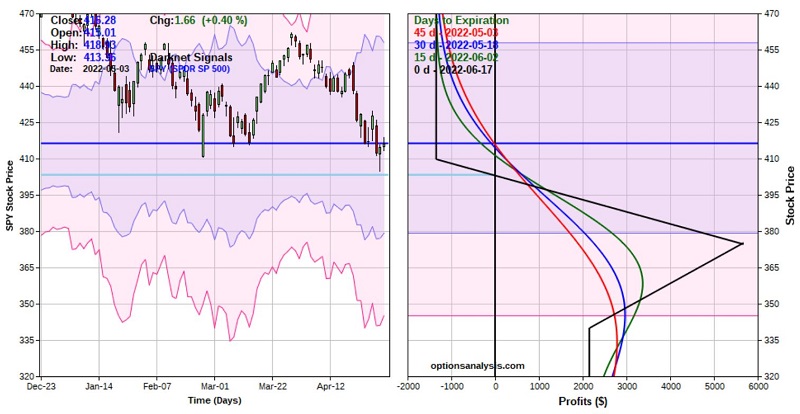
Things to note:
- If we set an arbitrary profit target of $395 a share for SPY and that price is reached, the profit on this position would be roughly $900 (if reached immediately) to $1,700 (if not reached until option expiration day on 6/17).
- An alternative would be to buy more than a 1-lot and sell half if $395 a share for SPY is reached and let the remaining position ride
- FYI, if the S&P 500 "crashed" 20% (not a prediction - just doing a hypothetical) to $333, the open profit on this position would be approximately $2,700
- Note that if SPY drops below $405 a share, time decay helps this position (i.e., each colored line shows progressively greater profit as time progresses)
- If held until expiration, this position loses money if SPY is at any price above $403.27 - i.e., SPY MUST decline before 6/17, or this trade will end in a loss
Natural Gas
Natural gas rallied sharply into an April high and then pulled back. It has rallied back up to the previous high in the last several weeks. Now, the big question is, "will its breakout cleanly to the upside, or will it fail to breakout to the upside and form a double top?" We cannot answer that question. However, several useful indicators can help us assess the probabilities.
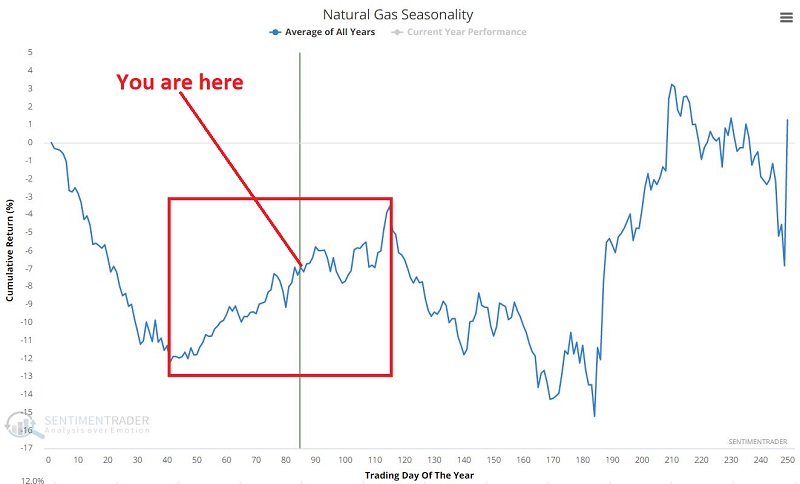
The chart below displays the Annual Seasonal Trend for natural gas. The current favorable period suggests that there may still be some room (and time) to run.
On a more sobering note, the chart below displays those days when Natural Gas Optix was above 66. Note that natural gas can continue to run much higher and for some time following such a reading. So this current reading does not necessarily suggest an imminent top but is one reason why traders should watch closely to see if a double top forms.
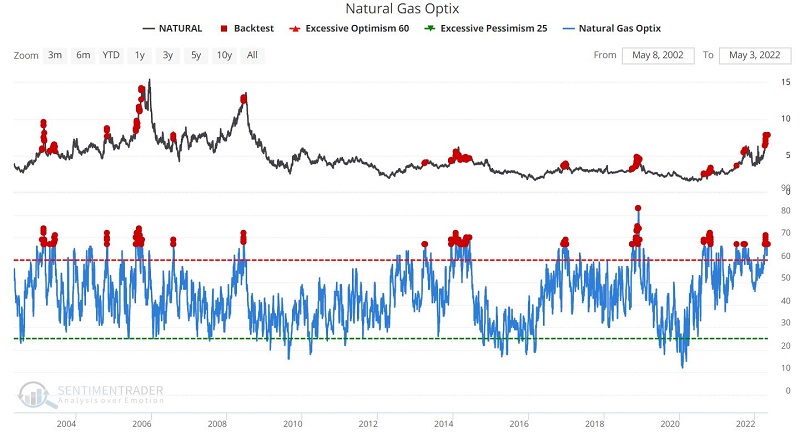
The results in the table below suggest that - while natural gas may still have some upside - historically, the odds strongly favor the bears once this current rally runs out of steam.
Traders who are long natural gas: Might consider taking partial profits if natural gas falters at resistance and letting the rest run, with a relatively tight trailing stop. If natural gas can break out and keep running, there is no reason not to go along for the ride. However, a wary eye must be kept on the exit if a trader does not want to run the risk of giving back a significant gain.
Traders looking to play the short side: Might keep a very close eye on natural gas in the days and weeks ahead. History suggests that the reversal may be swift and severe when the top comes - whether as a double top now or after a breakout and another runup.
Traders who are uncomfortable trading futures contracts might consider ticker UNG (the United States Natural Gas Fund, LP) or options on UNG as a lower dollar risk way to participate.
What the research tells us…
Both of these markets are at a critical juncture. The stock market is attempting to put in a double bottom, and natural gas is in danger of forming a double top. Picking tops and bottoms is an inherently risky game. However, using SPY and/or UNG options can allow a trader to risk only a specific amount of risk capital to participate.