
Quick hits: Consumer Confidence reaches a new low

Key Points
- The University of Michigan Consumer Confidence survey recently plummeted to its lowest reading ever
- As it turns out, history suggests this may be a good thing
- The latest reading is NOT a "buy signal" per se. It is a signal "to open your mind to the possibility of a buy signal"
The one thing that never changes
Human nature is the one thing that never changes - particularly regarding the financial markets. The never-ending struggle between fear and greed is essentially what propels the markets. Yes, good earnings are helpful, and bad earnings are unhelpful. But ultimately, it is what investors "think" - or at least how they "feel" - about current and future events that drive them to buy, sell, hold or hide.
Invariably, as "things" (most notably, stock prices and the overall economy) get worse, investors en masse become ever more pessimistic. And when stock prices are rising, and the economy is humming, investors lull themselves into a false sense of security that the good times will never end. The same as it ever was. This leads me to invoke the following:
Jay's Trading Maxim #306: Human nature can be a detriment to trading success and should be avoided as much as humanly possible.
The other thing that never changes
The other thing that never changes is how the financial press reports low consumer sentiment. It is always presented in the direst manner possible, with the spoken or unspoken implication being that things are awful and likely to stay that way. Which - ironically - serves to reinforce low consumer confidence.
However, in most extreme cases, this interpretation is entirely wrong.
University of Michigan Consumer Confidence
The University of Michigan Consumer Sentiment Index is a consumer confidence index published monthly by the University of Michigan. The index is normalized to have a value of 100 in December 1964, and we have data going back to 1953. NOTE: This is now known as The Thomson/Reuters University of Michigan Consumer Sentiment Index.
For a complete description of this indicator, see this page. The chart below displays the S&P 500 Index on top and the University of Michigan Consumer Confidence poll on the bottom.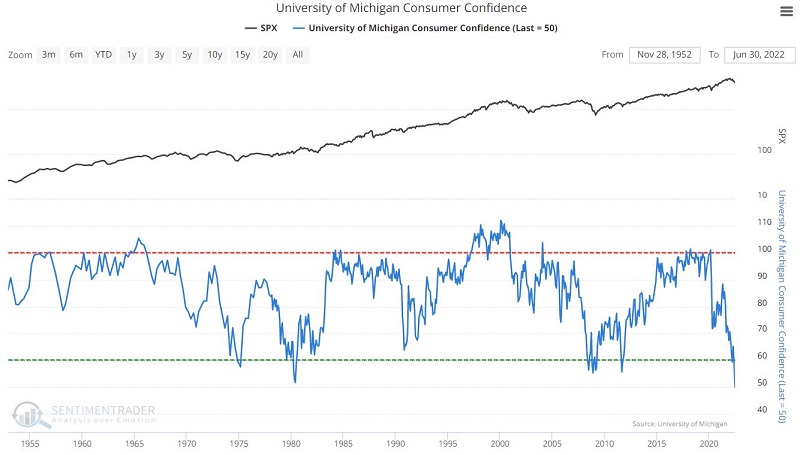
Note that this poll has dropped to its lowest reading at the far right. In other words, consumer confidence is lower today than ever since the first month of data back in 1953.
What you need to know is that:
- When times are perceived to be good/improving, consumers are happy; when times are perceived to be bad/worsening, they are less optimistic
- When consumer confidence declines significantly, the financial press always reports that fact in the direst tone possible (i.e., consumers are giving up, the economy is tanking - or will soon tank - and there is little reason for optimism)
Except for one thing. Like all decent sentiment/contrarian indicators, this interpretation is precisely backward.
Drops below 58
The chart below highlights those rare occasions when the U of M consumer confidence poll dropped below 58% for the first time in 12 months.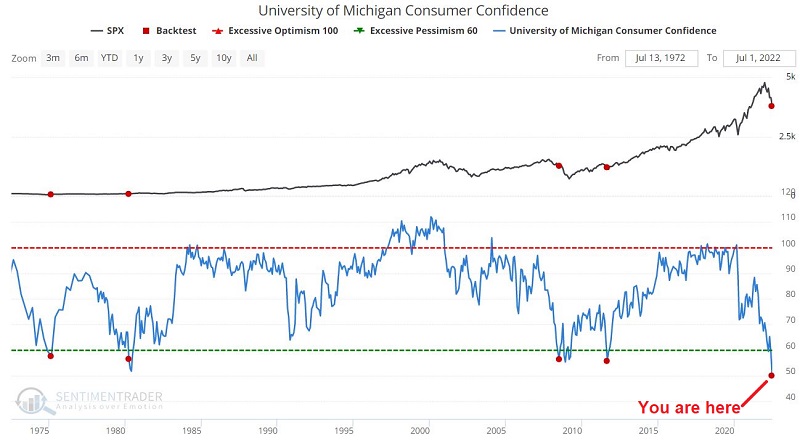
The table below displays S&P 500 performance following previous signals. 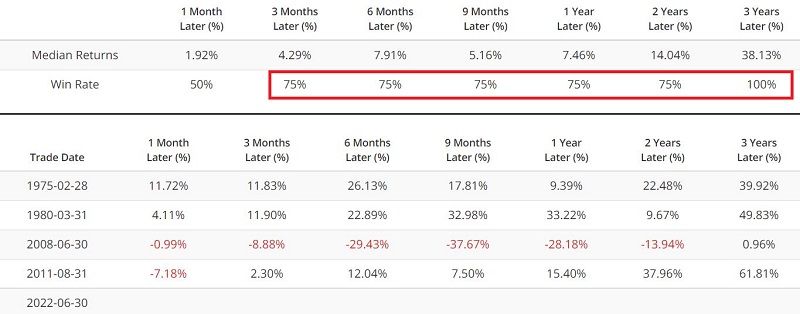
It is clear that the 2008 signal was too early and that the market fell hard (the ultimate low occurred eight months later) and took quite a while to rebound. Highly favorable results followed the other signals over one to three years.
What the research tells us…
The key point is simple: Extremely bearish sentiment is typically - though notably, not always - indicative of a stock market and economy on the verge of bottoming out. How long until and how far from the bottom are more difficult questions to answer. History suggests we are nearing a bottom - in terms of time until the bottom and/or price magnitude. However, the 2008 experience reminds us to treat this indicator NOT as a "buy" signal but as more of a "keep your mind open to the possibility of a favorable surprise" signal.
The most important thing that the latest U of M study tells us is that we should fight fear and keep a close eye out for signs of a reversal or the establishment of a new uptrend - with the understanding that some further patience may be required.