Products
SentimenTrader Trading Tools
‍
Backtest Engine
My Trading Toolkit
Correlation Analysis
Seasonality
Market Prediction
Indicators & Data API
‍
Proprietary Indicators & Charts
Market Data API
Strategies & Scanner
‍
50+ Trading Strategies
Smart Stock Scanner
Smart Option Scanner
Research Reports
‍
Research Solutions
Reports Library
Free Resources
Simple Backtest Calculator
Simple Seasonality Calculator
The Kelly Criterion Calculator
Sentiment Geo Map
Public Research Reports
Education
Sentiment Indicators
Technical Indicators
Pricing
Company
About
In the News
Testimonials
Client Success Stories
Contact
Log inLoginSign up
< BACK TO ALL REPORTS

Quick Hits: Analyst Price Changes and Major Index Combo

Jay Kaeppel
2022-07-13
Extremes in sentiment can come in many forms. The keys to using this information are to know what to look for and to take note when a variety of signals occur in close proximity. Two more indicators just gave recent signals.

Key Points

  • Analysts spent most of the early part of 2022 revising their stock price estimates lower; that process has now reversed
  • Upside reversals from a low level are typically a favorable contrarian sign
  • Professional hedgers and small speculators have very different views of where the major stock market indexes are headed - hedgers are bullish, and speculators are bearish
  • This configuration is typically a bullish sign for stocks

Analyst Price Changes

This data series tracks the net number of S&P 500 stocks for which Wall Street analysts have upgraded their price target. It is calculated by taking the total number of stocks with a price upgrade minus the total number with a price downgrade. It tends to act as a contrary indicator when it reaches an extreme reading.

The chart below displays those times when Analyst Price Changes crossed above -130. In other words, the series first must fall to a very negative number - indicating rampant bearishness as analysts downgrade their expectations for a large number of stocks. Then a reversal back above -130 must occur.

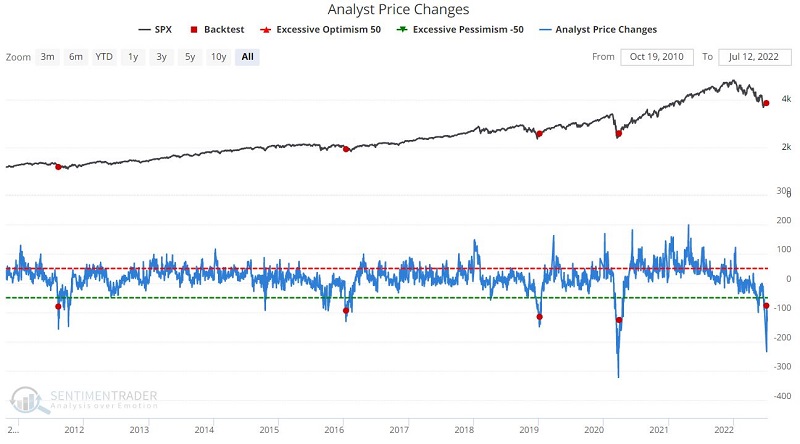
The most recent signal occurred on 7/6/2022. The table below displays performance for the S&P 500 Index following previous signals.
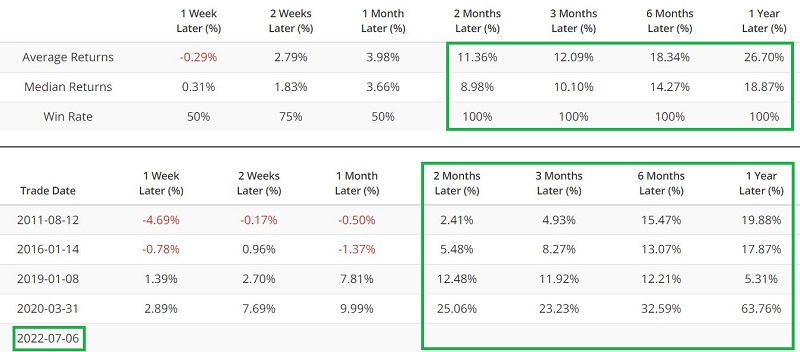
Major Index Combo

This data series reflects the positions of hedgers and small speculators in the S&P 500, Nasdaq 100, and DJIA futures. It combines the full-size contract and e-mini, adjusting for contract size, and calculates the dollar value. The chart is a one-year stochastic of hedger positions minus speculator positions, so if it reads 100, then hedgers are the most exposed to stocks in at least a year, and speculators are the least exposed. This is computed as a non-contrary indicator, which can be a good sign for stocks when the Combo is exceptionally high (an indicator reading above 80). Conversely, readings below 20 are usually a negative sign for stocks.

The chart below displays those times when the 10-week average of the Major Index Combo indicator rose above 66.

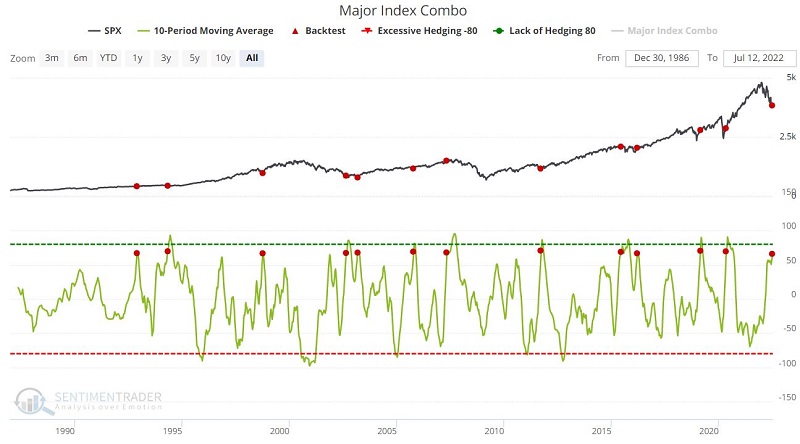
The most recent signal occurred on 7/5/2022. The table below displays performance for the S&P 500 Index following previous signals.

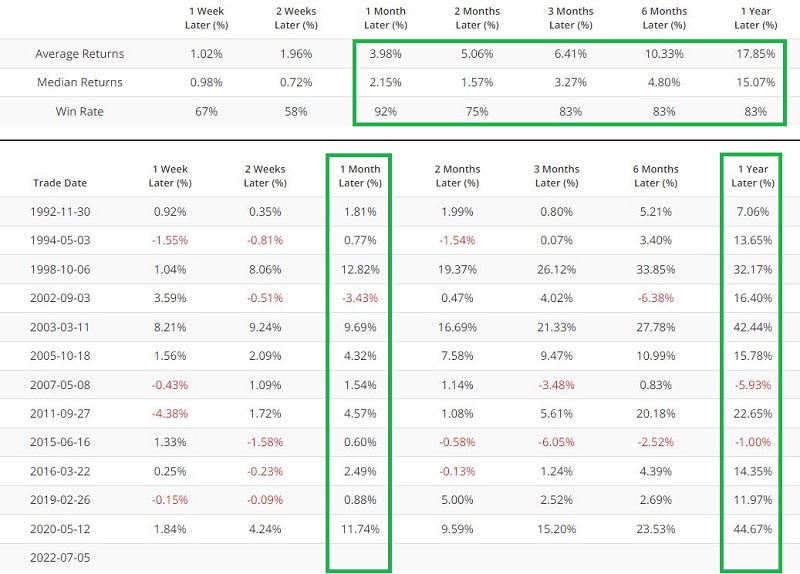
What the research tells us…

The indicators above are not intended to be used as standalone trading models. They offer a powerful - albeit only occasional - additional "weight of the evidence" to the bullish side of the ledger.

When professional market analysts significantly lower their future price estimates and reverse course en masse, it typically provides a powerful clue that sentiment is getting overdone to the bearish side. Likewise, when the "smart money" (professional hedgers) is bullish, and the "dumb money" (small speculators) is bearish, that tends to mark periods when a bullish reversal may be imminent.

As always, there is no guarantee that that will be the case this time. Still, the signals detailed above suggest at the very least that investors and traders ought to keep their minds open to the possibility of a buying opportunity.

PRODUCTS
SentimenTrader
Trading Tools
Indicators & Data API
‍
Strategies & Scanner
‍
Research Reports
FREE
RESOUrCES
Simple Backtest
Calculator
Simple Seasonality
Calculator
The Kelly Criterion
Calculator
Sentiment Geo Map
‍
Public Research Reports
‍
Education
Sentiment Indicators
‍
Technical Indicators
‍
Pricing
Bundle pricing
‍
FAQ
‍
Announcements
‍
COMPANY
‍
About
‍
In the News
‍
Testimonials
‍
Client Success Stories
CONTACT
‍
General Inquiries
‍
Media Inquiries
‍
Financial Professionals Inquiries
‍
© 2026 Sundial Capital Research Inc. All rights reserved.
Setsail Marketing
TermsPrivacyAffiliate Program
Risk Disclosure: The information and tools provided are for research and analytical purposes only and are not intended as investment advice. Market analysis involves uncertainty, and outcomes may differ from expectations. Users should conduct their own due diligence and consider their individual circumstances before making any financial decisions. Past performance is not necessarily indicative of future results.

Hypothetical Performance Disclosure: Hypothetical performance results have many inherent limitations, some of which are described below. No representation is being made that any account will or is likely to achieve profits or losses similar to those shown; in fact, there are frequently sharp differences between hypothetical performance results and the actual results subsequently achieved by any particular trading program. One of the limitations of hypothetical performance results is that they are generally prepared with the benefit of hindsight. In addition, hypothetical trading does not involve financial risk, and no hypothetical trading record can completely account for the impact of financial risk of actual trading. for example, the ability to withstand losses or to adhere to a particular trading program in spite of trading losses are material points which can also adversely affect actual trading results. There are numerous other factors related to the markets in general or to the implementation of any specific trading program which cannot be fully accounted for in the preparation of hypothetical performance results and all which can adversely affect trading results.

Testimonial Disclosure: Testimonials appearing on this website may not be representative of other clients or customers and is not a guarantee of future performance or success.