QQQ is being engulfed

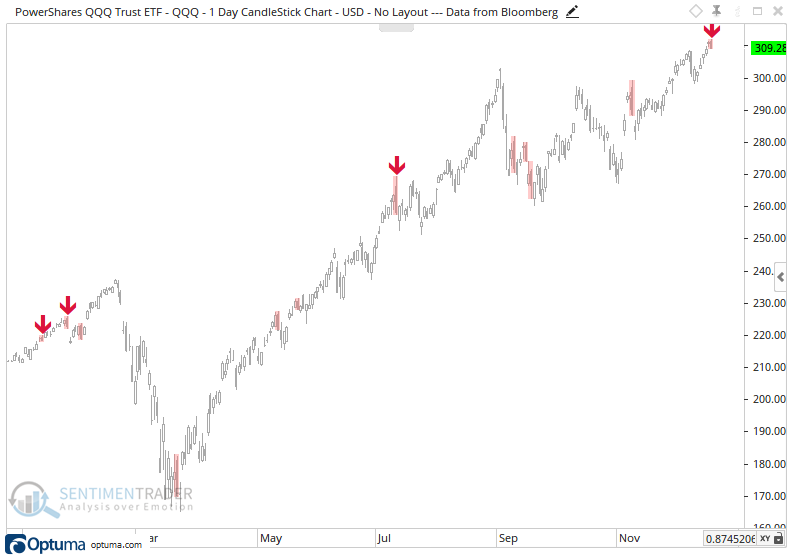
A rejection of the intraday rally has left some reversal patterns on the charts if we hold into the close. For the Nasdaq 100 trust, QQQ, it's carving out what technicians consider one of the more ominous patterns, a bearish engulfing bar.
From Investopedia:
"A bearish engulfing pattern is a technical chart pattern that signals lower prices to come. The pattern consists of an up (white or green) candlestick followed by a large down (black or red) candlestick that eclipses or "engulfs" the smaller up candle. The pattern can be important because it shows sellers have overtaken the buyers and are pushing the price more aggressively down (down candle) than the buyers were able to push it up (up candle)."
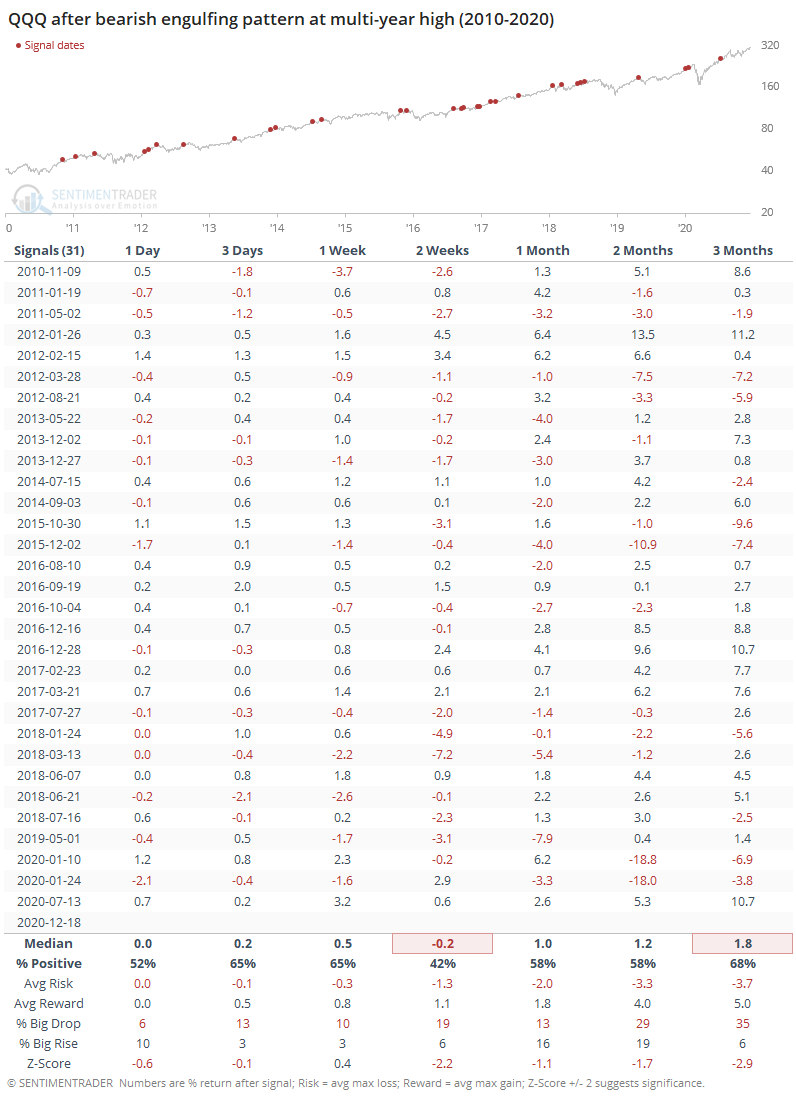
The chart below highlights these patterns, with the arrows indicating recent dates when it also triggered while QQQ had reached a multi-year high.
Since the 2009 low, this has triggered more than 30 times, and was relatively effective at preceding weakness over the next couple of weeks. Even up to 3 months later, average returns in QQQ were well below random.