Products
SentimenTrader Trading Tools
‍
Backtest Engine
My Trading Toolkit
Correlation Analysis
Seasonality
Market Prediction
Indicators & Data API
‍
Proprietary Indicators & Charts
Market Data API
Strategies & Scanner
‍
50+ Trading Strategies
Smart Stock Scanner
Smart Option Scanner
Research Reports
‍
Research Solutions
Reports Library
Free Resources
Simple Backtest Calculator
Simple Seasonality Calculator
The Kelly Criterion Calculator
Sentiment Geo Map
Public Research Reports
Education
Sentiment Indicators
Technical Indicators
Pricing
Company
About
In the News
Testimonials
Client Success Stories
Contact
Log inLoginSign up
< BACK TO ALL REPORTS

Q1 offers a stock market clue - Part II

Jay Kaeppel
2023-04-03
2022 was a forgetable year stock investors, with the benchmark S&P 500 Index declining over -19%. That's the bad news. The good news is that the first quarter of 2023 regostered a gain. Does this matter? History suggests that it does. In this piece, we examine the history of S&P 500 performance for the last nine months of the year following this configuration of price action.

Key points

  • The S&P 500 index registered an annual decline during 2022
  • The index recorded a gain during the first quarter of 2023
  • This configuration of performance has historically offered an essential clue for stock investors

Recent S&P 500 performance has been down and then up

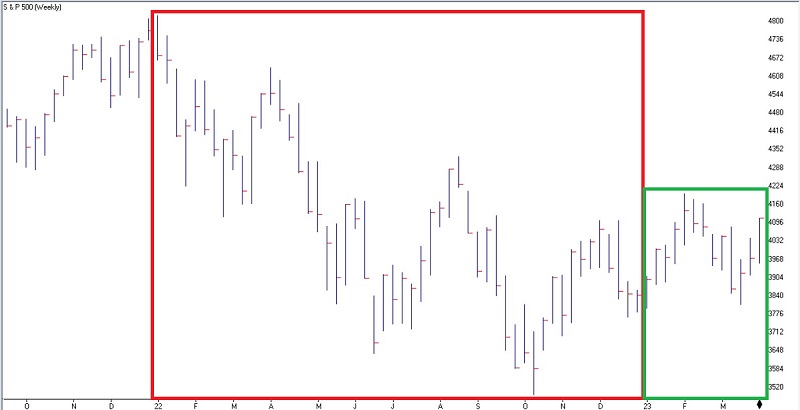
The S&P 500 was down over -19% in 2022. As you can see in the chart below (courtesy of AIQ TradingExpert), the index registered a gain for the first quarter of 2023.

Let's take a closer look at those times when this configuration occurred.

An up Q1 after a calendar year loss

In this article, I highlighted market performance for the last nine months of the year if the S&P 500 did not close below the previous December's low during the first quarter of the new year. In this piece, we will first examine market performance for the last nine months when the S&P 500 a) registered an annual loss during the previous calendar year and b) a gain during the first quarter of the current year.

In the past 69 years, the S&P 500 has registered an annual gain 49 times and a yearly loss 20 times. Following those 20 losing years, we will analyze the performance of the S&P 500 during the first quarter of the following year to see if it registers a 3-month gain or loss. If the S&P increases during this period, we will analyze S&P 500 performance for the remaining nine months of the year.

The chart below displays the cumulative gain achieved by holding the S&P 500 only during the last nine months if Q1 is positive after a down calendar year.

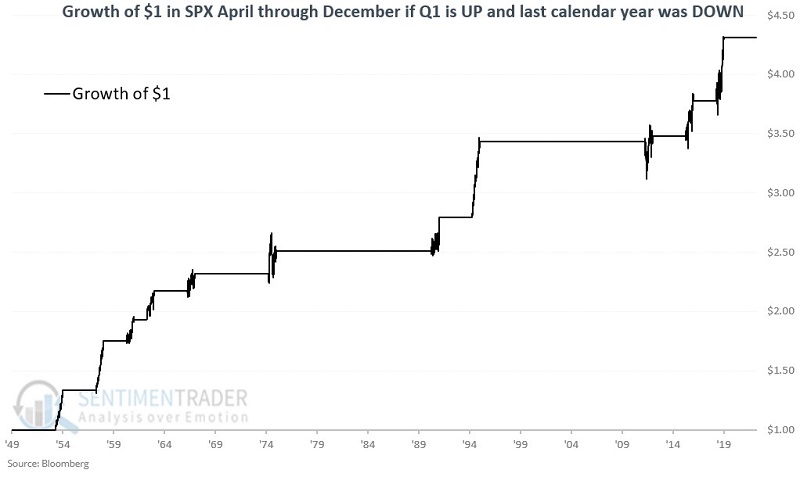
While the sample size is small (only 11 occurrences), the favorable historical bias is obvious. The table below summarizes the results.

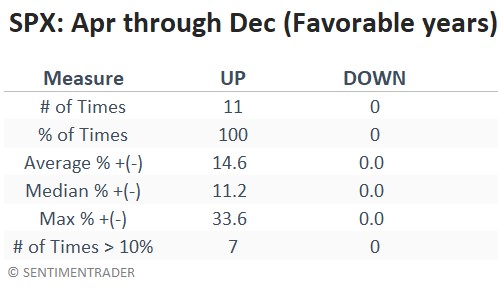
The table below displays the March 31st through December 31st results for years when the S&P 500 shows a Q1 gain following a down calendar year. It also displays the largest drawdown below the March 31st closing price for the S&P 500 Index.

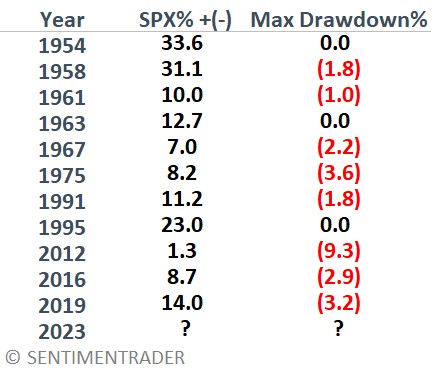
The most notable things regarding the results shown above are:

  • All 11 occurrences saw the S&P 500 register a nine-month gain
  • 10 of the 11 occurrences experienced no more than a -3.6% drawdown from the entry price (the exception was 2012 with a drawdown of -9.3%)

What the research tells us…

The first quarter of 2023 saw the S&P 500 Index register a gain following a calendar year loss during 2022. Over the past 70 years, a down year for the S&P 500 followed by a higher Q1 the next year has been a solidly bullish sign for the remainder of the year. With a double-digit average and median gain, a history of very shallow drawdowns, and no losing years, the results may inspire confidence regarding the market's prospects for the rest of 2023. That said, it is essential to remember that no indicator, pattern, oscillator, or trend is ever infallible. The above pattern is best used as part of an overall "weight of the evidence" approach rather than as a standalone trading method. 

PRODUCTS
SentimenTrader
Trading Tools
Indicators & Data API
‍
Strategies & Scanner
‍
Research Reports
FREE
RESOUrCES
Simple Backtest
Calculator
Simple Seasonality
Calculator
The Kelly Criterion
Calculator
Sentiment Geo Map
‍
Public Research Reports
‍
Education
Sentiment Indicators
‍
Technical Indicators
‍
Pricing
Bundle pricing
‍
FAQ
‍
Announcements
‍
COMPANY
‍
About
‍
In the News
‍
Testimonials
‍
Client Success Stories
CONTACT
‍
General Inquiries
‍
Media Inquiries
‍
Financial Professionals Inquiries
‍
© 2026 Sundial Capital Research Inc. All rights reserved.
Setsail Marketing
TermsPrivacyAffiliate Program
Risk Disclosure: The information and tools provided are for research and analytical purposes only and are not intended as investment advice. Market analysis involves uncertainty, and outcomes may differ from expectations. Users should conduct their own due diligence and consider their individual circumstances before making any financial decisions. Past performance is not necessarily indicative of future results.

Hypothetical Performance Disclosure: Hypothetical performance results have many inherent limitations, some of which are described below. No representation is being made that any account will or is likely to achieve profits or losses similar to those shown; in fact, there are frequently sharp differences between hypothetical performance results and the actual results subsequently achieved by any particular trading program. One of the limitations of hypothetical performance results is that they are generally prepared with the benefit of hindsight. In addition, hypothetical trading does not involve financial risk, and no hypothetical trading record can completely account for the impact of financial risk of actual trading. for example, the ability to withstand losses or to adhere to a particular trading program in spite of trading losses are material points which can also adversely affect actual trading results. There are numerous other factors related to the markets in general or to the implementation of any specific trading program which cannot be fully accounted for in the preparation of hypothetical performance results and all which can adversely affect trading results.

Testimonial Disclosure: Testimonials appearing on this website may not be representative of other clients or customers and is not a guarantee of future performance or success.