
Q1 offers a stock market clue

Key points
- During the first quarter of the year, the stock market offers a valuable clue regarding the remaining nine months
- The key is comparing the lowest S&P 500 closing price during the first quarter to the lowest close recorded during the previous December
- If the S&P 500 does not take out the previous December low during the first quarter of a new year, good things tend to follow
Comparing two closing prices
For this test, on March 31 each year, we will look at the lowest daily closing price for the S&P 500 Index during the first three months of the year. We will then compare that value to the lowest closing price recorded during December of the previous year.
A = Lowest SPX close from January 1 through March 31
B = Lowest SPX close during December of the previous year
If A >= B, we will deem the remaining nine months of the year as "favorable."
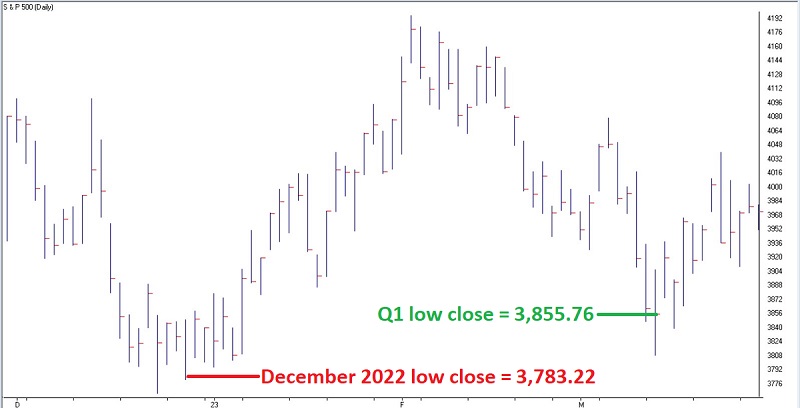
The chart below (courtesy of AIQ TradingExpert) displays the performance of the S&P 500 since December 2022. Note that the lowest close for SPX during December 2022 was 3,7783.22. The lowest close so far in 2023 was 3,855.76 on 2023-03-13. Barring a close below 3,855.76 before the end of March, Variable A above will be above Variable B, and the remaining nine months of 2023 will be deemed favorable.
Does this matter? Let's take a look at historical results.
A look at SPX's performance during favorable years
For the results that follow, we will look at two values. First, we measure the change in the S&P 500 Index from March 31 through December 31. We will also consider the lowest close from April through December compared to the March 31 close to understand how large a drawdown an investor might encounter.
To get a sense of overall performance, The chart below displays the cumulative growth of $1 invested in the S&P 500 Index only during April through December of favorable years.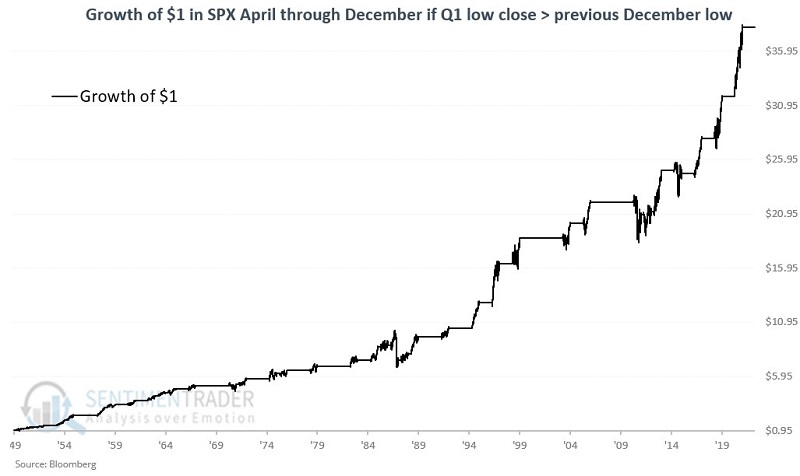
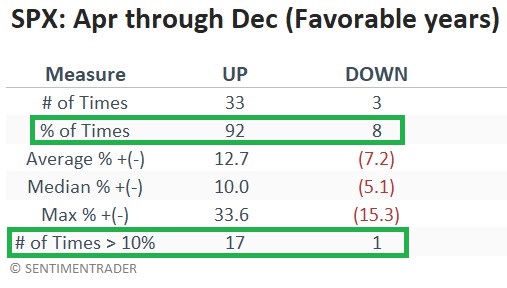
The table below summarizes the results.
The table below displays the March 31 through December 31 results for years when the S&P 500 lowest first-quarter close did not exceed the previous December close to the downside. It also displays the largest drawdown below the March 31st closing price for the S&P 500 Index.
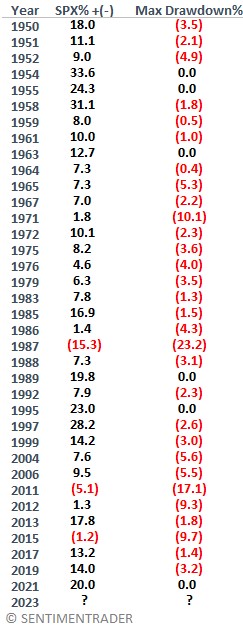
Of the 37 favorable years, 17 showed an April-December gain of over +10%. Only one year showed a loss of around -10% (1987 at -15.3%). Thirty-one years (84% of the time) experienced a maximum drawdown from March 31 to the end of the year of no more than -5.6%. Three years experienced a maximum drawdown of over -10%, including 1987 (-23.2%) and, more recently, 2011 (-17.1%).
Now let's talk about the realities of trading. A historical Win Rate of 92% over 70+ years of real-world data is something to take confidence in. Nevertheless, it is essential to remember that no one indicator is the "be all, end all." First, let's consider the outlier year of 1987. 1987 was sort of the "Titanic" of trading years. It started with great fanfare, and everyone enjoyed the ride - right up until it hit the iceberg (i.e., until the market crashed in October). By March 31, the S&P 500 was already up +20.5%, and it just kept going from there. By August 25, the S&P was up an astounding +39.1% for the year. Less than two months later, the index stood -33.2% below that peak and -22.9% below its March 31st level.
It should also be noted that three "favorable" years (1971, 1986, and 2012) witnessed April through December gains of less than +2%. The good news is that the S&P 500 enjoyed full-year gains of over +10% during these years. The bad news is that most of those gains were achieved in the year's first quarter, and the rest of the year mostly involved the market chopping around in a broad trading range, with only a meager April through December gain. Sitting through a -10.1% drawdown to end up with a nine-month gain of +1.8% (as in 1971) does not necessarily feel much like winning (for 1986, it was a -4.3% drawdown for a +1.4% gain, and for 2012 it was a -9.3% drawdown for a +1.3% gain).
For a trader viewing this strategy as a trading system, one complicating factor is risk management, i.e., where to place a stop-loss. In this case, history is not much help. Consider the table below that displays the five worst drawdowns experienced during a "favorable" year and the S&P 500 % gain or loss for the April through December period.
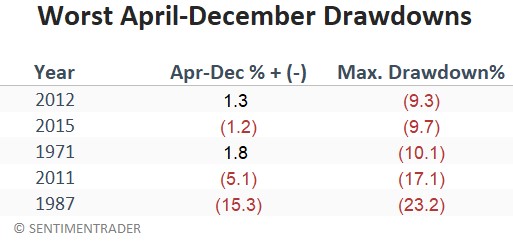
Consider a trader who decides to buy at the end of March on a signal described above and who enters a stop-loss order 9% below their entry price. In four of the five years displayed above, this trader would have been stopped out with a -9% loss only to see the market reverse that loss and end with either a small gain or a relatively meager loss.
The bottom line may be that the strategy detailed here should be used as part of a "weight of the evidence" approach to investing, not as a standalone model.
What the research tells us…
Momentum is an essential factor in the stock market. When a new year begins by holding steady or trending higher during the first quarter, more often than not, it sets the tone for the remainder of the year. If the S&P 500 Index can avoid closing below 3,855.76 through March 31, the above pattern will deem the next nine months as "favorable." A 92% historical Win Rate suggests good reliability and that investors should give the bullish case the benefit of the doubt as the rest of 2023 unfolds. Nevertheless, the outlier years of 1987 and 2011 remind us that there are no "sure things" in the stock market.