
Put/Call Premium Ratio reverses from an extreme

Key points
- The Put/Call Premium Ratio just crossed a critical level
- The sample size is relatively small, and no single indicator should be relied upon as a "trading system"
- Still, historical results are noteworthy, and the latest reading falls squarely on the favorable side of the stock market ledger
- This piece also highlights CTA positioning in stocks and SPX and NDX seasonality
The Put/Call Premium Ratio indicator reverses from an extreme reading
Our Put/Call Premium ratio indicator measures the ratio of total put premiums paid each week relative to total call premiums. It directly reflects how much options traders are paying for one relative to the other. That makes it an effective measure of real money, real-time, and leveraged sentiment. When it rises to an extreme, it is a highly reliable gauge of option-trader panic.
Like many sentiment indicators, extremes in the Put/Call Premium indicator can range from slightly extreme to highly extreme. As a result, it is difficult - and sometimes dangerous - to attempt to pinpoint a trigger level as the indicator is rising (i.e., it is extremely difficult - if not impossible - to predict a "top" in this indicator). A helpful alternative appears to be waiting for this indicator value to reach an extreme reading and then cross below a particular level.
The chart below highlights those rare dates when the Put/Call Premium ratio crossed below 1.59 for the first time in 26 weeks. The most recent signals occurred on 2023-01-27 and 2023-10-06.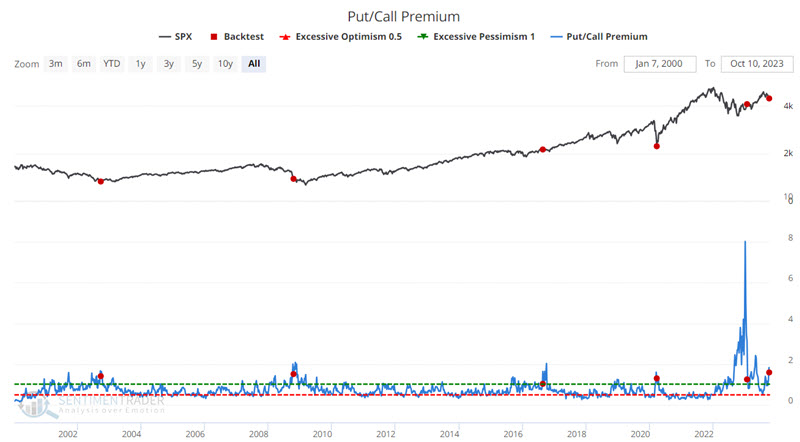
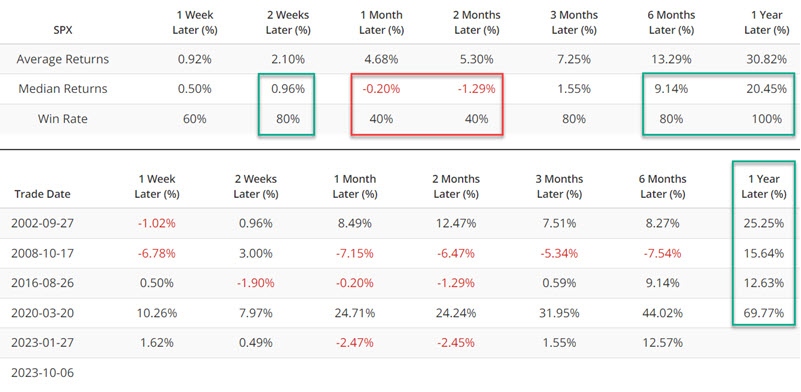
The table below summarizes the subsequent S&P 500 Index performance.
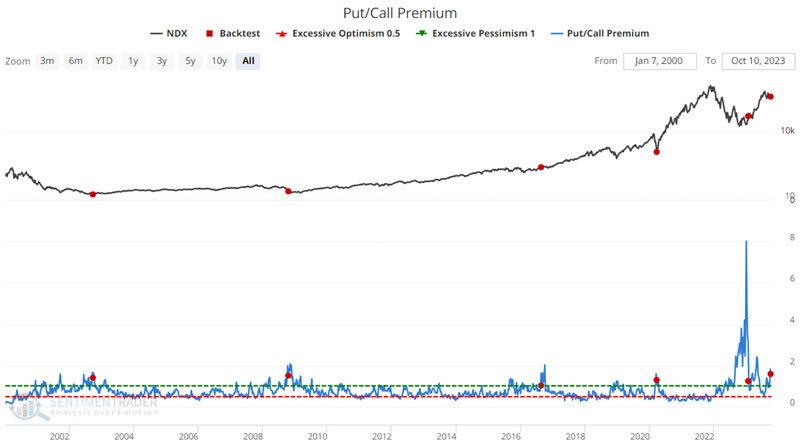
For those traders willing to take a more aggressive approach, the Nasdaq 100 Index has generated even more extreme results. The chart below highlights the same signals as above versus the Nasdaq 100 Index.
The table below summarizes subsequent Nasdaq Index performance.
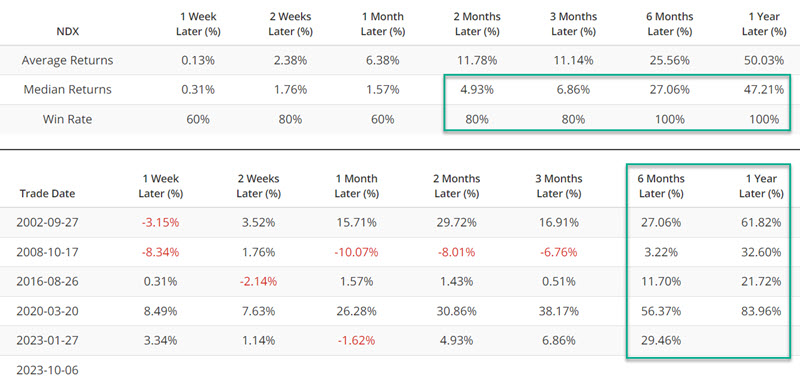
There is absolutely no guarantee that market performance in the year ahead will resemble those shown above. Also note the tendency or weakness in the early months following a signal, as the market sometimes "thrashes around" for a while following a significant selloff. Still, the six- and twelve-month results are compelling.
Bonus Indicator #1: CTA Positioning
I do not have access to the actual data for the CTA position in stocks indicator highlighted below. As a result, this indicator discussion is presented anecdotally and not quantitatively. With that in mind, the chart below (courtesy of @ShortBear) displays the CTA Position in U.S. Equities. The critical thing to note is the tendency for lows in this indicator to coincide with significant market bottoms.
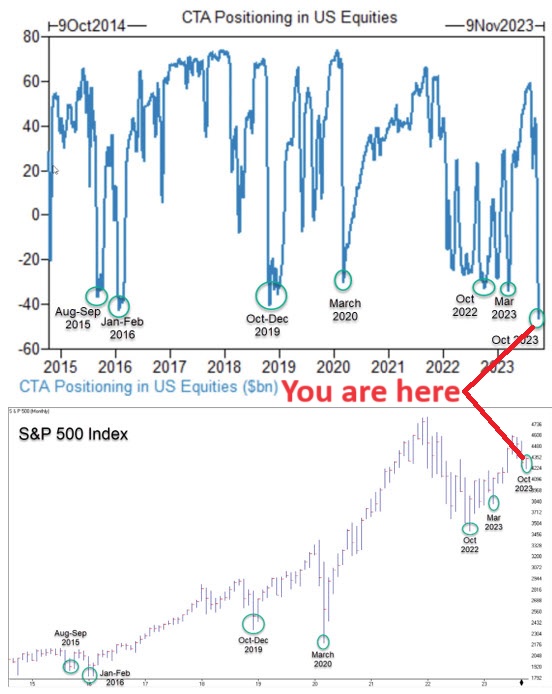
As a former CTA, this level of "Wrong Way Corrigan" activity among my brethren leaves me somewhat dismayed. That said, it should also be noted that by and large, commodity trading advisor activity tends to be trend-following in nature. The longer a trend lasts and the further it goes, the more likely CTAs en masse are to be long or short in line with the prevailing trend. Given that, it should not be surprising that, as a group, they tend to be significantly long at the top and significantly short at the bottom.
The critical thing to note in the chart above is that the latest reading represents the most significant net short position in the last ten years, i.e., CTAs as a group are significantly net short in the stock market. This raises the obvious question (which can only be answered in hindsight, "Is it different this time?"
Bonus Indicator #2: Seasonality
In the charts below, note that the S&P 500 Index and the Nasdaq 100 Index are nearing a seasonal low and a generally favorable time of year (i.e., mid-October until the end of December).
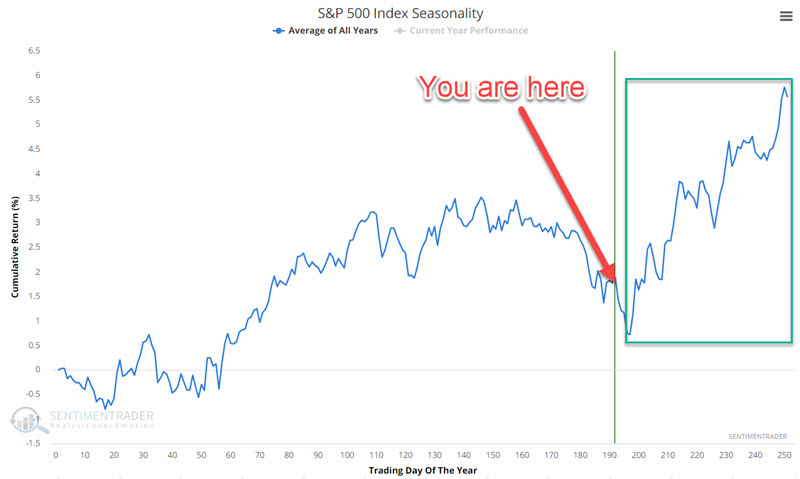
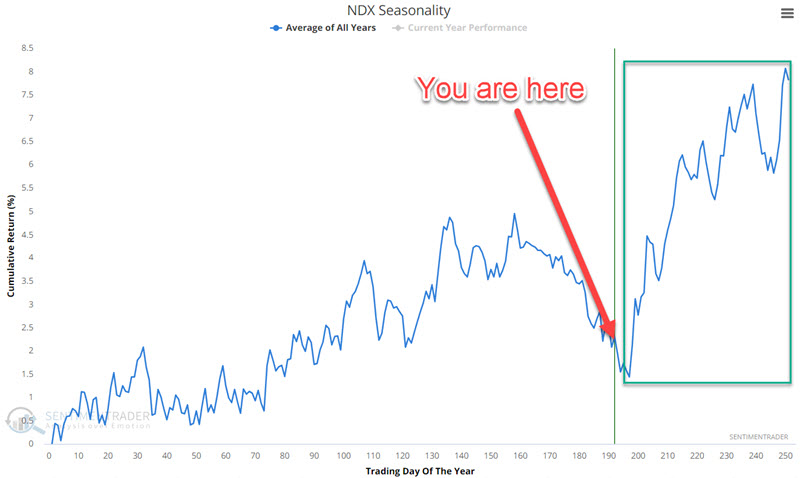
As always, seasonality is not a roadmap. It is merely an average of what has happened in the past. Two caveats to keep in mind:
- Historically, the next several days have seen some severe market weakness heading into a seasonal low
- There is no guarantee that the historical seasonal tendencies will occur "this time around"
What the research tells us…
No indicator or combination of indicators is ever infallible. Macroeconomic conditions and geopolitical events can cause significant disturbances in the financial markets. That said, the primary reason for focusing on objective indicators is to remove the emotion that generally accompanies these conditions and events. While caveats certainly apply, the items highlighted in this piece appear to suggest that investors be looking closely for a buying opportunity.