
Put/Call indicator signals signal disbelief among traders

Key points:
- Put/call data can at times offer a glimpse into the psyche of traders and offer clues to potential market direction
- When option speculators bet heavily in one direction or the other, they almost invariably tend to be wrong
- Our Gamma Exposure and Retail Only Buying indicators have flashed recent favorable signals
Gamma Exposure as a % of Market Capitalization crosses a threshold
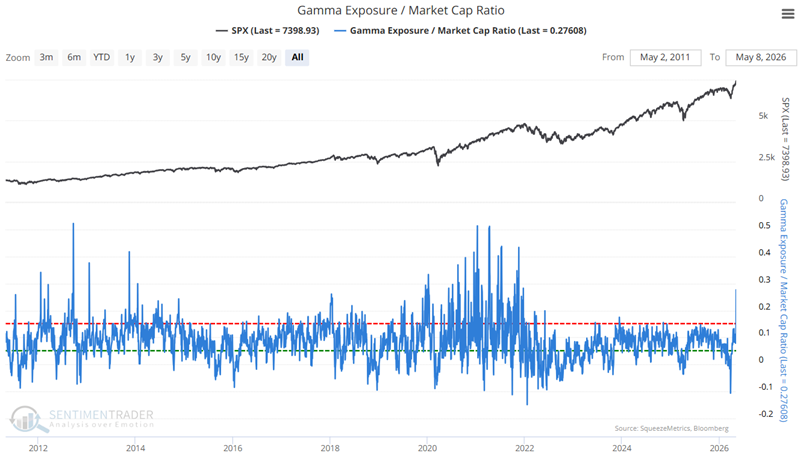
Gamma exposure refers to the sensitivity of existing option contracts to changes in the underlying price of the S&P 500 (see our Gamma Exposure chart for more details). This chart shows Gamma Exposure relative to the market capitalization of U.S. stocks. The higher the level, the more potential selling pressure. It is shown in thousandths of a percent.
The chart below shows daily data for the indicator. Note that on occasions, the data spikes sharply. For our purposes, we will use a longer-term moving average of daily data to smooth out day-to-day gyrations.
The chart below highlights all dates when the 50-day moving average of the Gamma Exposure / Market Cap Ratio indicator