Products
SentimenTrader Trading Tools
‍
Backtest Engine
My Trading Toolkit
Correlation Analysis
Seasonality
Market Prediction
Indicators & Data API
‍
Proprietary Indicators & Charts
Market Data API
Strategies & Scanner
‍
50+ Trading Strategies
Smart Stock Scanner
Smart Option Scanner
Research Reports
‍
Research Solutions
Reports Library
Free Resources
Simple Backtest Calculator
Simple Seasonality Calculator
The Kelly Criterion Calculator
Sentiment Geo Map
Public Research Reports
Education
Sentiment Indicators
Technical Indicators
Pricing
Company
About
In the News
Testimonials
Client Success Stories
Contact
Log inLoginSign up
< BACK TO ALL REPORTS

Price trend conditions for the S&P 500 show further deterioration

Dean Christians
2022-02-22
A composite model that assesses price trends for the S&P 500 fell to the lowest level since the pandemic crash. Let's review the outlook for the S&P 500 after similar bullish to bearish reversals in trend conditions.

Key points:

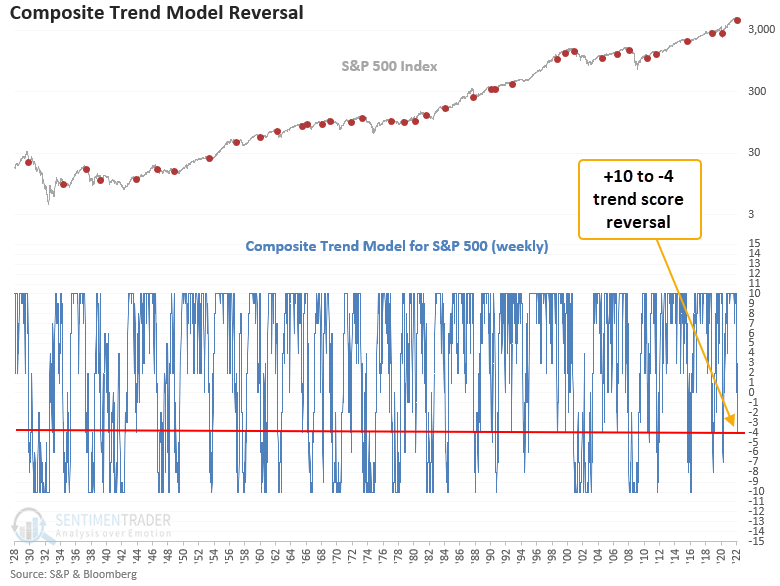
  • A composite trend model for the S&P 500 fell to the lowest level since the pandemic crash
  • The recent change in the composite score comes after 10 out of 10 components showed a positive trend
  • Similar trend score changes show modest returns for the S&P 500 on a short to medium-term basis

A bullish to a bearish reversal in trend indicators for the S&P 500

A composite trend model that uses weekly data for the S&P 500 recently showed 10 out of 10 components with a positive trend. At the close of trading on Friday, the trend score fell to -4. Let's conduct a study to assess the outlook for S&P 500 after similar trend score reversals.

Please click here to see a note on how I construct the composite trend model. Duration lengths will vary depending on whether it's applied to daily, weekly, or monthly time frames. 

The weekly composite trend model now shows the following unfavorable trend conditions.

  1. SPX < 13-week average
  2. SPX < 26-week average
  3. SPX < 52-week average
  4. SPX 13-week average declining
  5. SPX 26-week average declining
  6. SPX close below 26-week low (close)
  7. SPX 13-week fast stochastic < 30

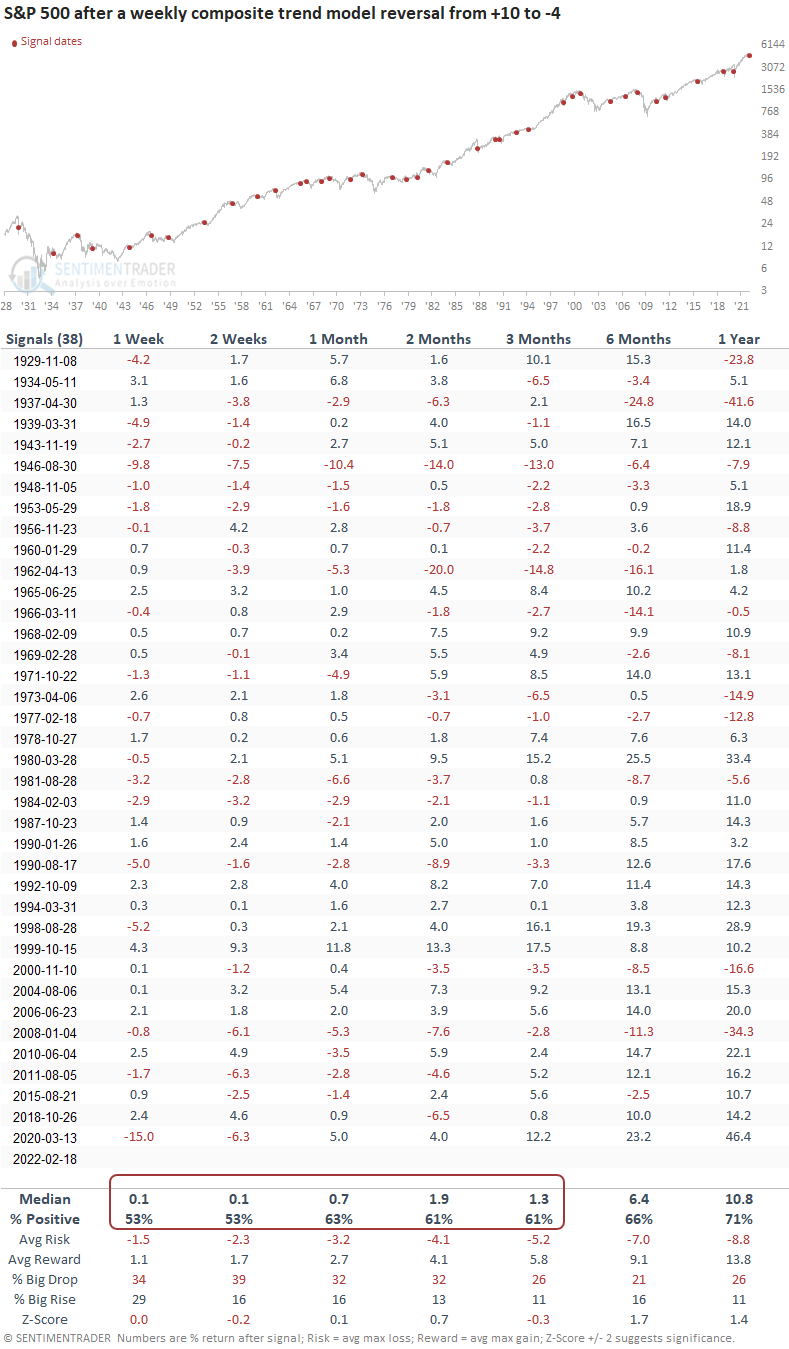
Similar signals show modest results on a short to medium-term basis

This signal triggered 38 other times over the past 93 years. After the others, S&P 500 future returns were modest, and win rates were in line to slightly worse than historical averages across short to medium time frames. The 6- and 12-month windows show better returns with win rates around historical averages.

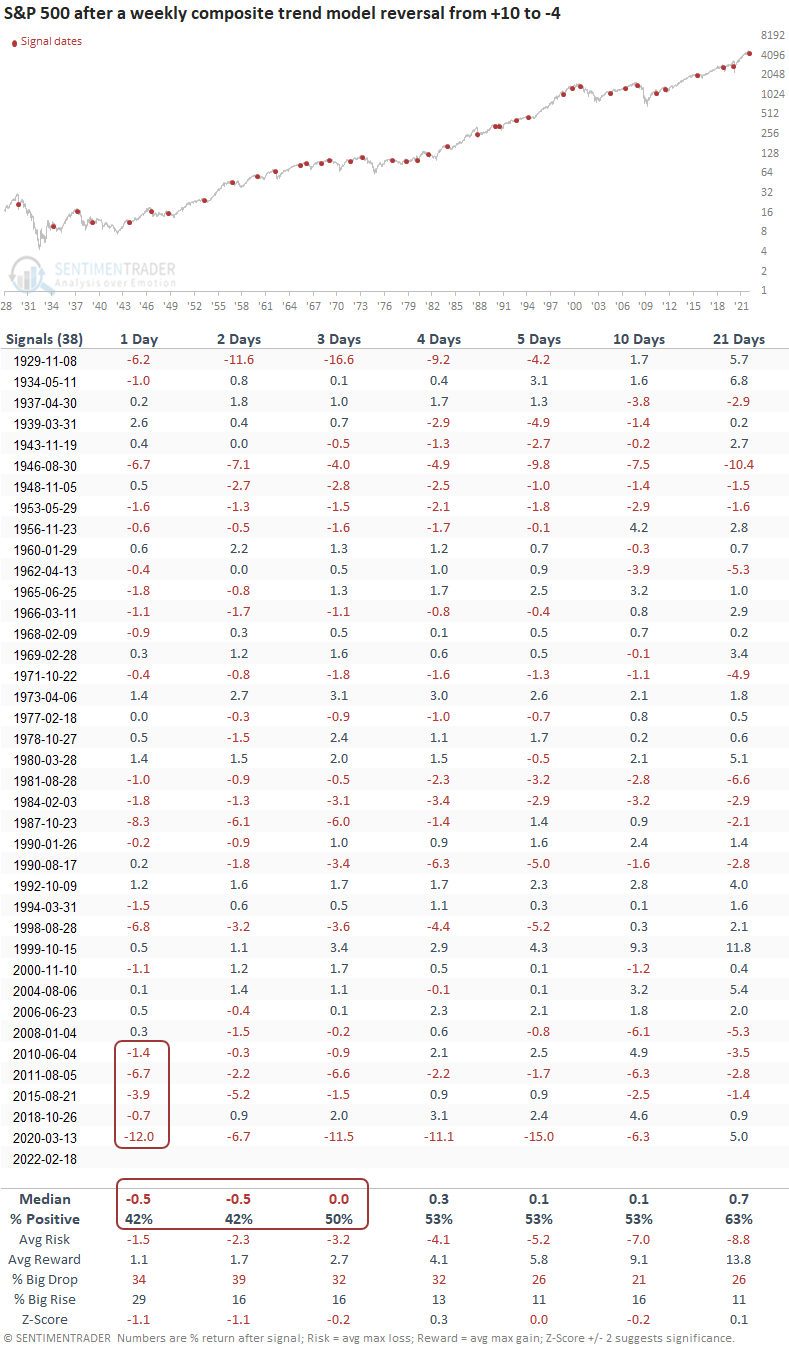
The outlook for the next few days suggests caution

If I apply the signals to an ultra-short-term outlook table, the next few days suggest caution. The previous 5 instances were negative 1-day later, with some eye-opening results.

What the research tells us...

The reversal in a composite trend model for the S&P 500 suggests modest returns for stocks across short to medium-term time frames. When I apply the signals to an ultra-short-term outlook table, one shouldn't be surprised by some downside follow-through in the next few days. The long-term returns look better than average. Given that one will only know in hindsight whether the current correction develops into something more significant, an improvement in the composite trend model provides a better risk/reward scenario. I've found a trend score reversal from -4 or worse to +8 works well.

PRODUCTS
SentimenTrader
Trading Tools
Indicators & Data API
‍
Strategies & Scanner
‍
Research Reports
FREE
RESOUrCES
Simple Backtest
Calculator
Simple Seasonality
Calculator
The Kelly Criterion
Calculator
Sentiment Geo Map
‍
Public Research Reports
‍
Education
Sentiment Indicators
‍
Technical Indicators
‍
Pricing
Bundle pricing
‍
FAQ
‍
Announcements
‍
COMPANY
‍
About
‍
In the News
‍
Testimonials
‍
Client Success Stories
CONTACT
‍
General Inquiries
‍
Media Inquiries
‍
Financial Professionals Inquiries
‍
© 2026 Sundial Capital Research Inc. All rights reserved.
Setsail Marketing
TermsPrivacyAffiliate Program
Risk Disclosure: The information and tools provided are for research and analytical purposes only and are not intended as investment advice. Market analysis involves uncertainty, and outcomes may differ from expectations. Users should conduct their own due diligence and consider their individual circumstances before making any financial decisions. Past performance is not necessarily indicative of future results.

Hypothetical Performance Disclosure: Hypothetical performance results have many inherent limitations, some of which are described below. No representation is being made that any account will or is likely to achieve profits or losses similar to those shown; in fact, there are frequently sharp differences between hypothetical performance results and the actual results subsequently achieved by any particular trading program. One of the limitations of hypothetical performance results is that they are generally prepared with the benefit of hindsight. In addition, hypothetical trading does not involve financial risk, and no hypothetical trading record can completely account for the impact of financial risk of actual trading. for example, the ability to withstand losses or to adhere to a particular trading program in spite of trading losses are material points which can also adversely affect actual trading results. There are numerous other factors related to the markets in general or to the implementation of any specific trading program which cannot be fully accounted for in the preparation of hypothetical performance results and all which can adversely affect trading results.

Testimonial Disclosure: Testimonials appearing on this website may not be representative of other clients or customers and is not a guarantee of future performance or success.