Products
SentimenTrader Trading Tools
‍
Backtest Engine
My Trading Toolkit
Correlation Analysis
Seasonality
Market Prediction
Indicators & Data API
‍
Proprietary Indicators & Charts
Market Data API
Strategies & Scanner
‍
50+ Trading Strategies
Smart Stock Scanner
Smart Option Scanner
Research Reports
‍
Research Solutions
Reports Library
Free Resources
Simple Backtest Calculator
Simple Seasonality Calculator
The Kelly Criterion Calculator
Sentiment Geo Map
Public Research Reports
Education
Sentiment Indicators
Technical Indicators
Pricing
Company
About
In the News
Testimonials
Client Success Stories
Contact
Log inLoginSign up
< BACK TO ALL REPORTS

Price and Seasonality align for Soybeans

Jay Kaeppel
2026-04-09
Soybeans are entering a favorable seasonal period. With price action presently favorable - and as long as it holds up - traders may find an opportunity playing the long side of this highly cyclical market. Non-futures traders can participate via the ETF ticker SOYB. Details herein.

Key points:

  • Soybeans are entering a favorable seasonal period and soybean price action remains favorable
  • This combination of favorable price action and seasonality offers speculators a potential opportunity
  • ETF ticker SOYB offers an alternative to trading riskier soybeans futures

Price and seasonality align for soybeans

Soybeans have historically been one of the most reliably cyclical markets. Due to the planting and harvesting seasons, prices tend to rise from early October into mid-July, and decline the rest of the time. Of course, this is NOT a roadmap to how price will act in any given year. Nevertheless, when seaonality and price action agree for soybeans, the odds favor the trading playing that side of the market.

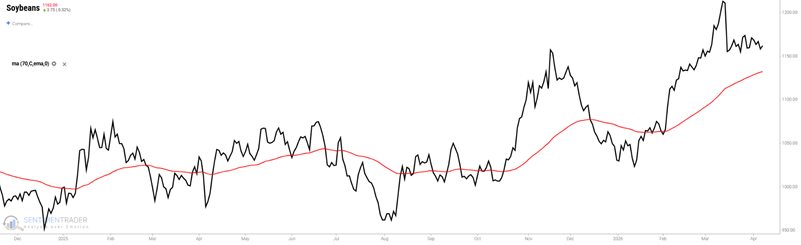
The chart below shows soybean price action for the last several years. Note that price is presently in an established uptrend.

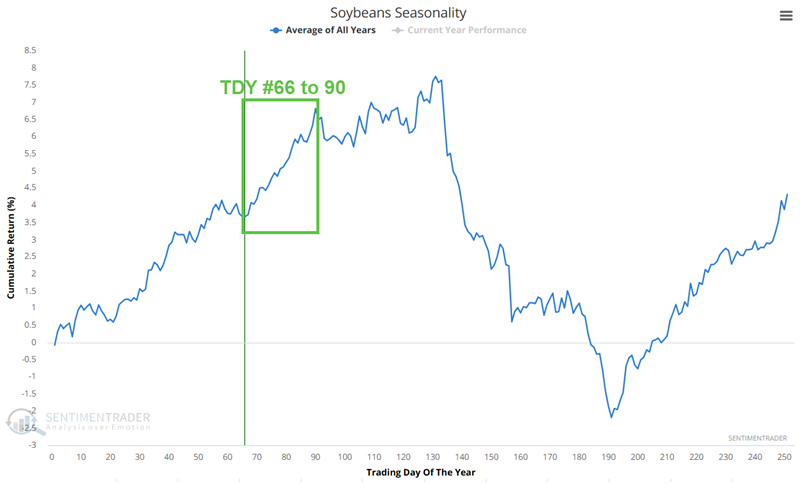
The chart below shows the Annual Seasonal Trend for soybeans, and highlights the period form Trading Day of the Year (TDY) #66 through TDY #90. For 2026, that period runs from the close on April 8th through May 12th.

The next chart shows the cumulative hypothetical gain fr

Sorry, you don't have access to this report

Upgrade your subscription plan to get access
Go to Dasboard
PRODUCTS
SentimenTrader
Trading Tools
Indicators & Data API
‍
Strategies & Scanner
‍
Research Reports
FREE
RESOUrCES
Simple Backtest
Calculator
Simple Seasonality
Calculator
The Kelly Criterion
Calculator
Sentiment Geo Map
‍
Public Research Reports
‍
Education
Sentiment Indicators
‍
Technical Indicators
‍
Pricing
Bundle pricing
‍
FAQ
‍
Announcements
‍
COMPANY
‍
About
‍
In the News
‍
Testimonials
‍
Client Success Stories
CONTACT
‍
General Inquiries
‍
Media Inquiries
‍
Financial Professionals Inquiries
‍
© 2026 Sundial Capital Research Inc. All rights reserved.
Setsail Marketing
TermsPrivacyAffiliate Program
Risk Disclosure: The information and tools provided are for research and analytical purposes only and are not intended as investment advice. Market analysis involves uncertainty, and outcomes may differ from expectations. Users should conduct their own due diligence and consider their individual circumstances before making any financial decisions. Past performance is not necessarily indicative of future results.

Hypothetical Performance Disclosure: Hypothetical performance results have many inherent limitations, some of which are described below. No representation is being made that any account will or is likely to achieve profits or losses similar to those shown; in fact, there are frequently sharp differences between hypothetical performance results and the actual results subsequently achieved by any particular trading program. One of the limitations of hypothetical performance results is that they are generally prepared with the benefit of hindsight. In addition, hypothetical trading does not involve financial risk, and no hypothetical trading record can completely account for the impact of financial risk of actual trading. for example, the ability to withstand losses or to adhere to a particular trading program in spite of trading losses are material points which can also adversely affect actual trading results. There are numerous other factors related to the markets in general or to the implementation of any specific trading program which cannot be fully accounted for in the preparation of hypothetical performance results and all which can adversely affect trading results.

Testimonial Disclosure: Testimonials appearing on this website may not be representative of other clients or customers and is not a guarantee of future performance or success.