
Price Action and Seasonality Suggest Caution in Crude Oil

Key points:
- Crude Oil is soon entering its weakest seasonal period of the year
- In addition, October to December weakness has often extended through the following January when a simple price filter is unfavorable
- Crude oil enters this unfavorable seasonal period already in an established downtrend
Crude Oil often experiences fourth-quarter weakness
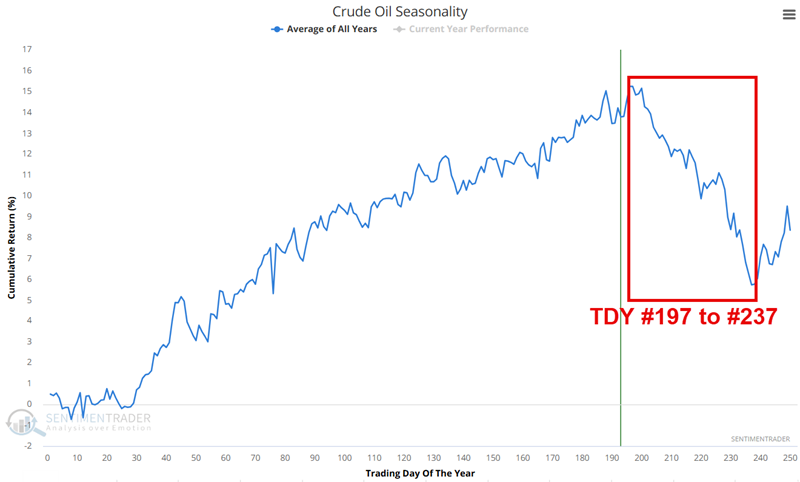
The chart below displays the annual seasonal trend for crude oil futures. Note the tendency for severe weakness between Trading Day of the Year (TDY) #197 and #237. For 2025, this period runs from the close on October 6th to December 1st.
The chart below displays the hypothetical equity achieved by holding a long position in crude oil only during this period every year since 1983.
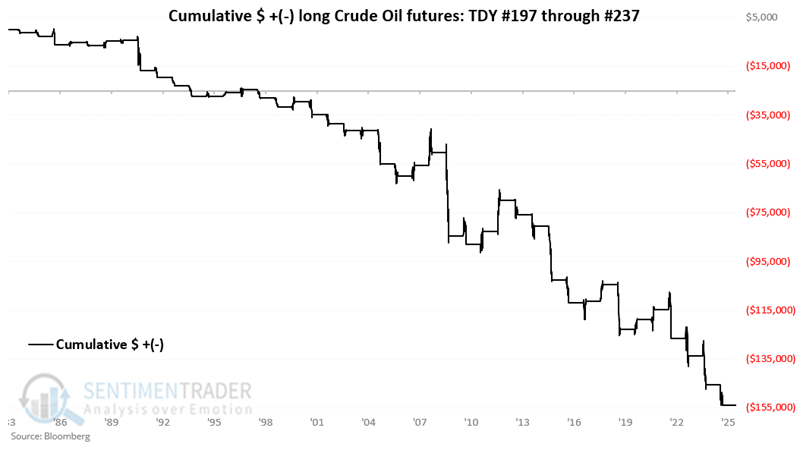
There is no guarantee that crude oil will decline during this period; however, it is clearly a dangerous time to try to play the long side. The table below summarizes crude oil futures performance during this period since 1983.
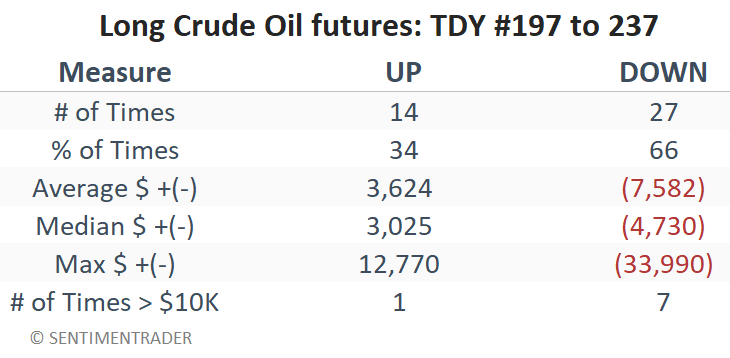
A price decline during this period is no sure thing, as roughly one out of every three years has seen crude oil advance during this period (34% Win Rate). However, note that losses during this period can be severe, and period moves exceeding $10K have skewed to the downside by a factor of 7-to-1.
We have also found that weakness during this period tends to beget more weakness throughout December and into January of the following year. Let's take a closer look at this phenomenon.
Crude Oil from October through January
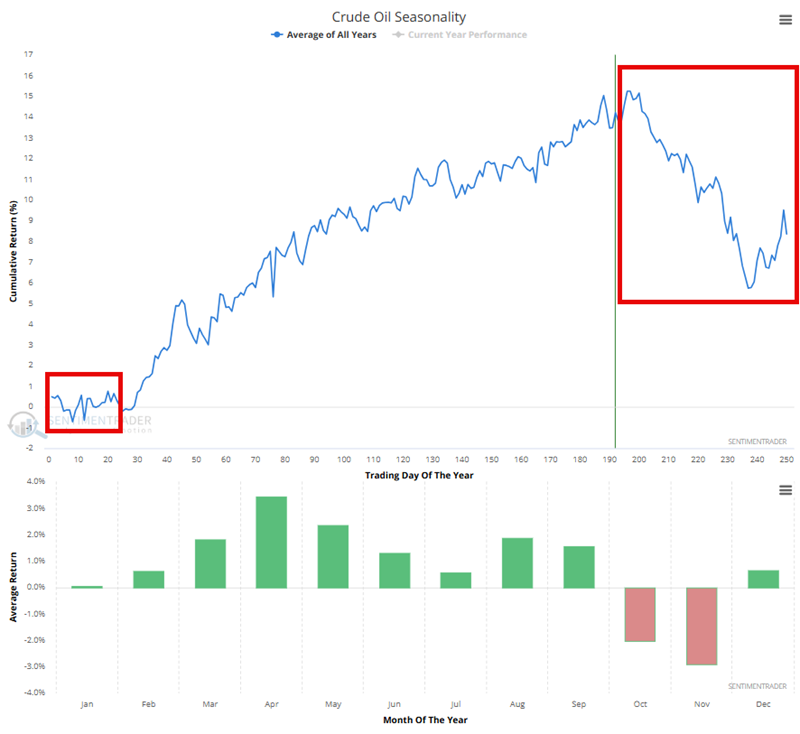
The chart below displays the annual seasonal trend for crude oil futures. Note the sharp drop-off in the fourth quarter of the year, the tendency for a bounce in late December, and another period of weakness into late January.
The chart below displays the hypothetical equity curve achieved by holding a long position in crude oil futures only during the months of October through January each year since 1983. A one-point movement in the price of a contract equals a $1,000 change in contract value.
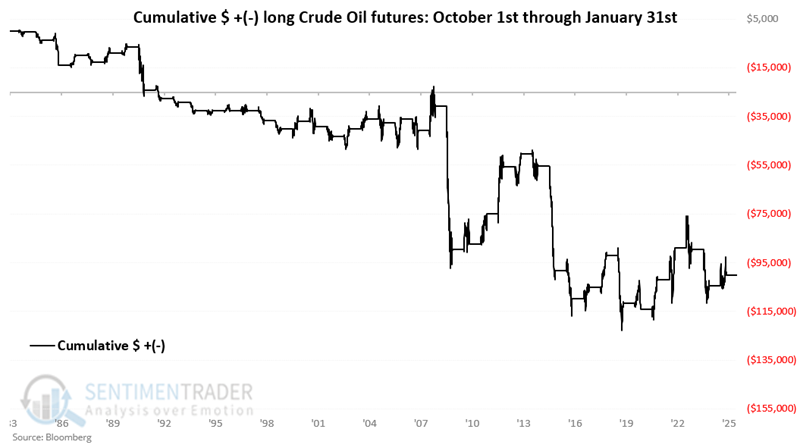
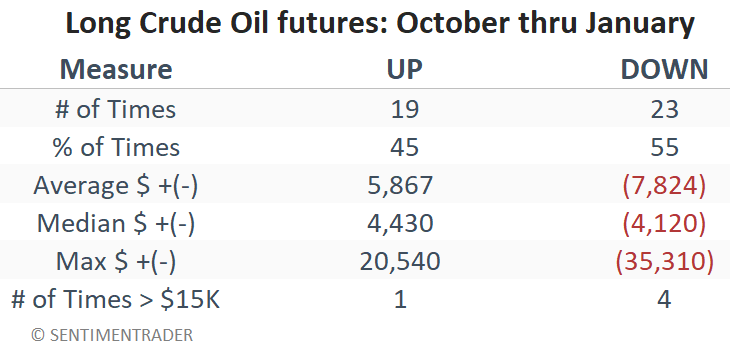
The table below summarizes crude oil futures performance during this four-month period.
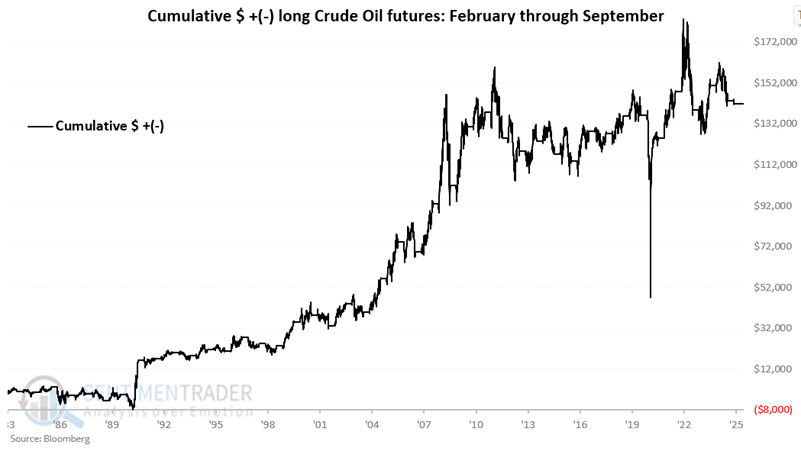
To better appreciate the tendency for weakness during October through January, compare and contrast the performance for crude oil shown during February through September, as shown in the chart below.
Adding a price filter to designate a trend
For our filter, we will compare the month-end price of crude oil to its four-month moving average. If the month-end close is above the four-month moving average, the price trend is favorable; if below, it is unfavorable.
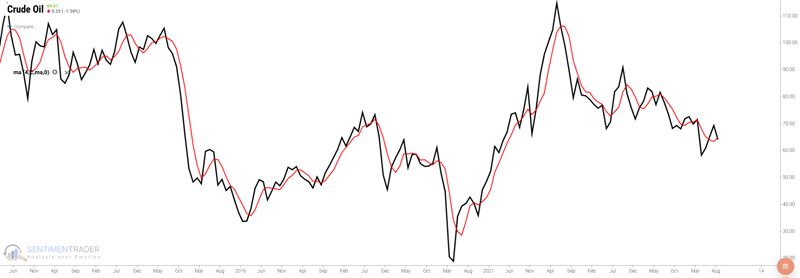
The chart below displays crude oil spot month futures with a four-month moving average. Note that at the end of September 2025, crude closed below its four-month moving average.
Combining trend and seasonality
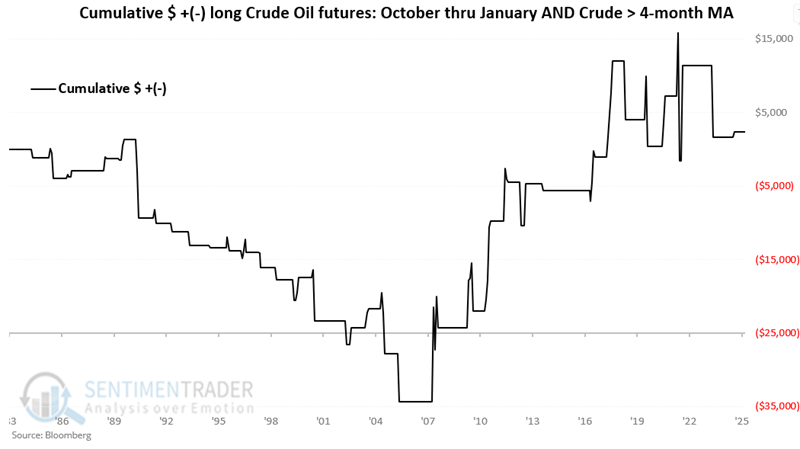
The chart below displays the cumulative dollar return for crude oil futures if held long only when the current month is October, November, December, or January, and crude oil closed the previous month above its four-month moving average. The long-term results are decidedly mixed, but the hypothetical net result is a gain of $2,420.
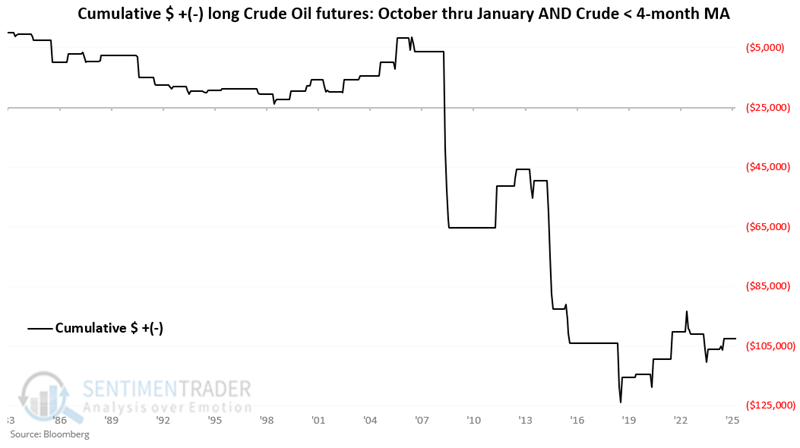
Contrast that to the chart below, which shows the return if crude oil futures are held long only when:
- The current month is October, November, December, or January
- and crude oil closed the previous month below its four-month moving average
The results were essentially neutral through 2006 but have been decisively bearish since. The net hypothetical result is a loss of $102,580.
Crude oil will begin the month of October 2025 with price in a downtrend, suggesting a potentially bearish setup for the months ahead. However, note that if crude closes a month back above its four-month average, this particular pattern is negated during the following month.
What the research tells us…
Crude oil's performance during the fourth quarter has demonstrated a historical tendency to show weakness. In addition, when price is below the four-month moving average, continued price weakness has often extended through January next year. With a bearish configuration setting up for the end of September, this history suggests that crude oil traders remain cautious about being bullish on crude oil. There is always the possibility that fundamental factors in the market will overwhelm the seasonal tendencies highlighted above. However, until crude shows some signs of strength, traders are encouraged to focus on eschewing the long side of crude oil and playing only the short side.