
PPI inflation and the stock market - Part I

Key points
- Extremes in inflation have historically been unfavorable for stocks
- This piece details three separate stock market indicators based on changes in the Producer Price Index
- In Part II, we will put the three indicators covered here into one comprehensive stock market model
PPI overview
According to Investopedia:
The Producer Price Index (PPI) measures the average change over time in the prices domestic producers receive for their output. It is a measure of inflation at the wholesale level that is compiled from thousands of indexes measuring producer prices by industry and product category. The index is published monthly by the U.S. Bureau of Labor Statistics (BLS). The PPI is different from the consumer price index (CPI), which measures the changes in the price of goods and services paid by consumers.
The chart below displays a history of the monthly value for the PPI.
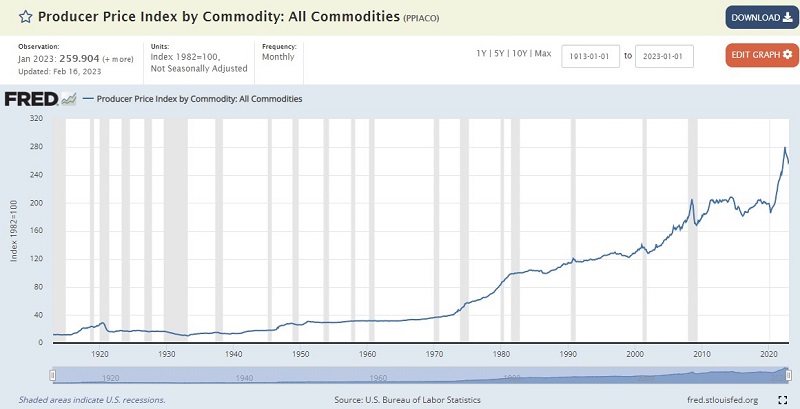
What really matters is not the raw value of the index but the rate of change of the raw value over time. By comparing the latest monthly value to the value from 12 months ago, we can determine the percentage rate-of-change over that time. We refer to this 12-month rate-of-change as the PPI inflation rate.
The chart below displays the PPI inflation rate since 1914. This chart highlights the +9% and -12% levels for reasons we will discuss in a moment.
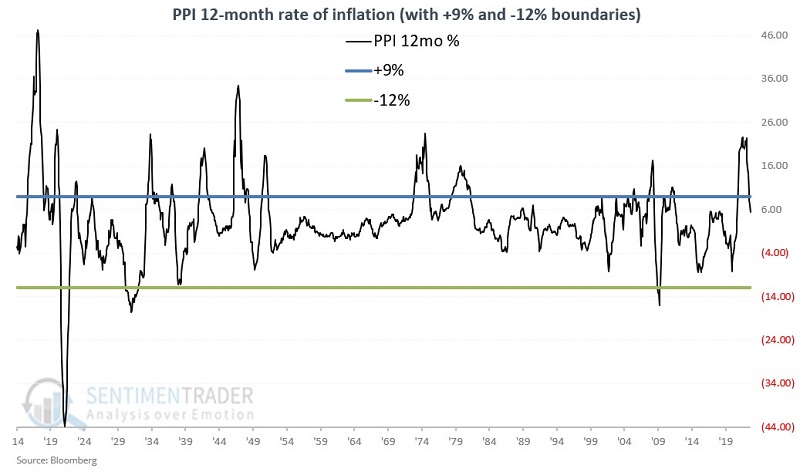
As you can see, PPI inflation can vary widely over time. For our purpose, readings above +9% are considered "extreme inflation", readings below -12% are considered "extreme deflation", and everything in between is considered "normal inflation."
Now let's begin the process of building an investment model using indicators based on the PPI. Note that the latest PPI is normally reported around the middle of each month, however, all indicators below are calculated at month-end regardless of when the latest update was released during the current month.
PPI Indicator #1: PPI 12-month rate-of-change
The first indicator measures the 12-month percentage rate-of-change in the Producer Price Index monthly raw value, as shown above.
A = Most recent PPI value
B = ((A / value for A 12 months ago)-1) * 100
In other words, B is the 12-month rate-of-change for PPI. The rule from there is simple:
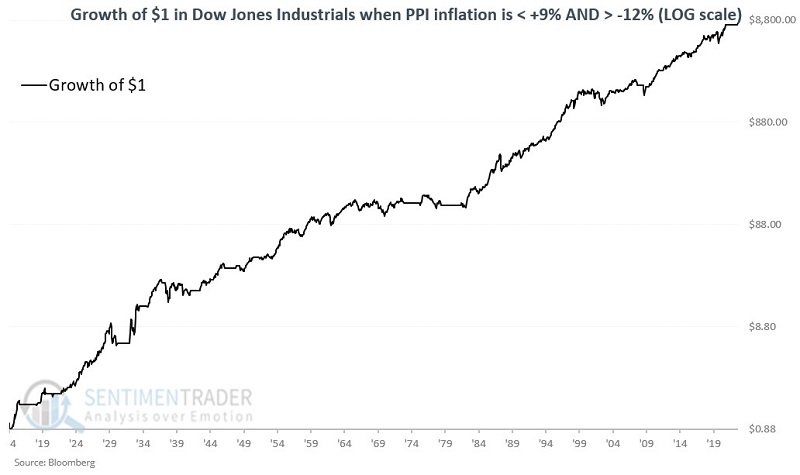
- If B is < +9% AND B is > -12%, then PPI Indicator #1 is bullish; otherwise, it's bearish.
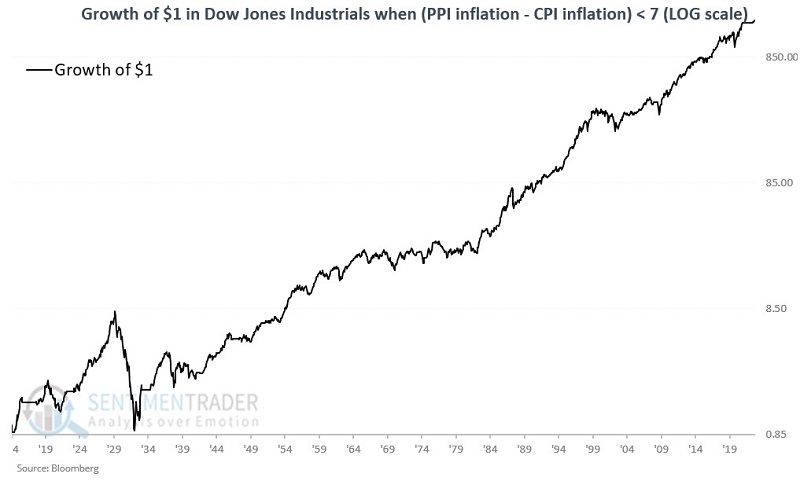
The logarithmic chart below displays the growth of $1 in the Dow Jones Industrials Index since 1914 if PPI Indicator #1 is bullish. The cumulative growth is +799,187%.
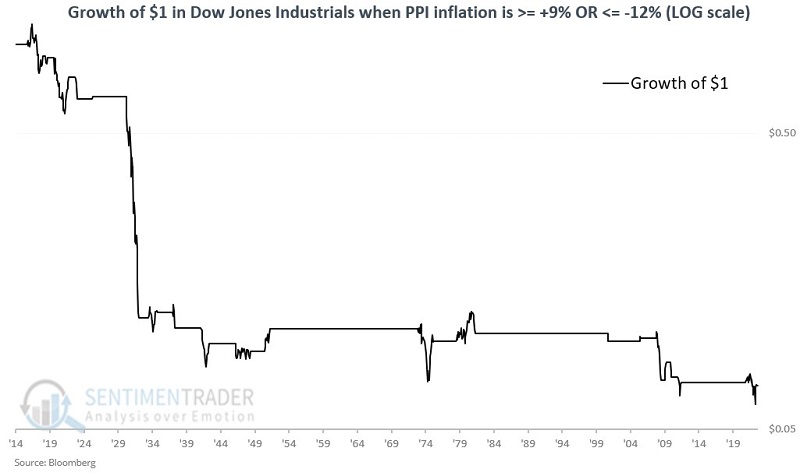
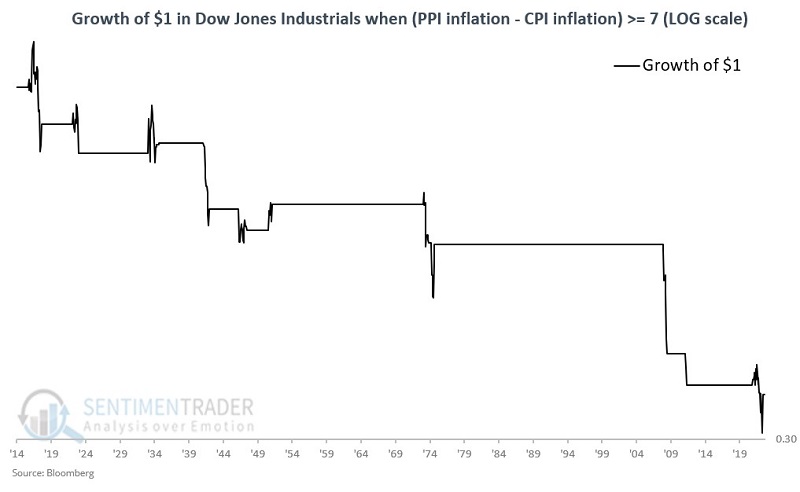
The chart below displays the growth of $1 in the Dow Jones Industrials Index since 1914 if PPI Indicator #1 is not bullish. The cumulative decline is -93%.
The table below summarizes Dow performance based on whether the PPI Indicator #1 end the prior month bullish or bearish.
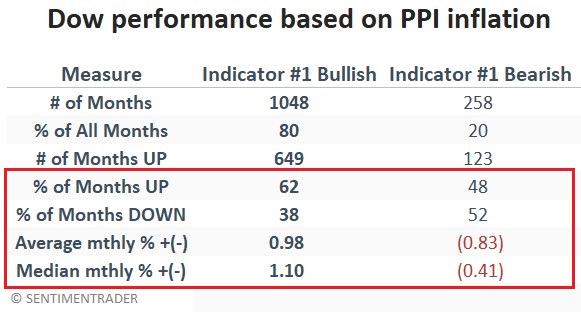
There is no guarantee from month-to-month that the market will rise if PPI is in the acceptable range, nor that the market will decline if PPI is outside of the acceptable range. Nevertheless, the overall long-term trend is unmistakable - when PPI becomes extreme (in either direction), the stock market typically struggles.
PPI Indicator #2: PPI minus CPI
The second indicator measures the difference between the 12-month percentage rate-of-change in the Producer Price Index versus the same measure for the Consumer Price Index. Generally speaking, producer price trends tend to lead consumer price trends. If the annual change in producer prices gets too far ahead of consumer prices, it usually means that a significant bout of inflation is either taking place or is about to occur. This tends to be unfavorable for stocks.
A = Most recent PPI value
B = ((A / value for A 12 months ago)-1) * 100
C = Most recent CPI value
D = ((A / value for A 12 months ago)-1) * 100
E = B - D
In other words, E is the 12-month rate-of-change for PPI minus the 12-month rate-of-change for CPI.
The rule from there is simple:
- If E is > 7, then PPI Indicator #2 is bearish; otherwise, it's bullish.
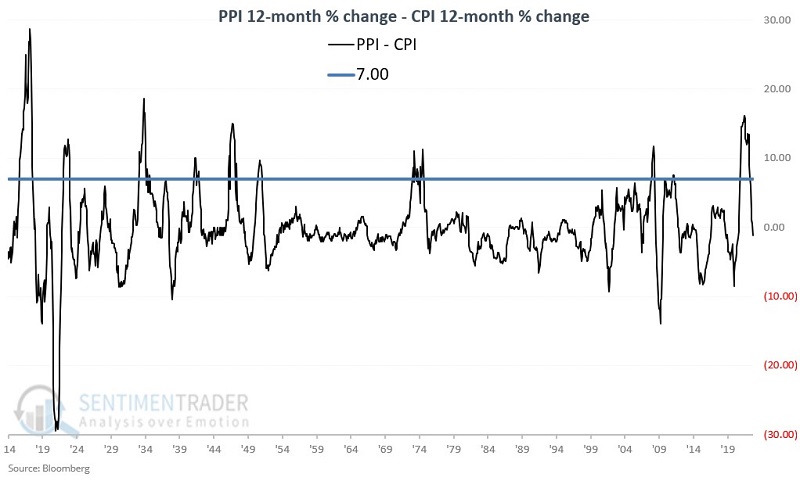
The chart below displays the month-end difference between PPI inflation and CPI inflation and marks the 7.00 level. Reading above 7.00 indicate that significant inflationary pressure is building.
The chart below displays the growth of $1 in the Dow Jones Industrials Index since 1914 if PPI Indicator #2 is bullish. The cumulative growth is +158,563%
The chart below displays the growth of $1 in the Dow Jones Industrials Index since 1914 if PPI Indicator #2 is not bullish. The cumulative decline is -64.8%.
The table below summarizes Dow performance based on whether the PPI Indicator #2 end the prior month bullish or bearish.
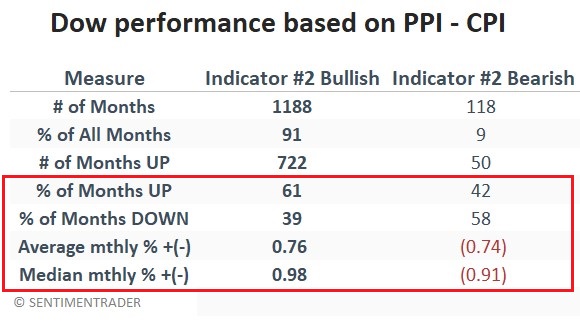
It is fair to note that Indicator #2 was no help on a standalone basis during the 1929-1932 stock market plunge. Nevertheless, we are not advocating using this indicator on a standalone basis but rather a part of a larger model that we will detail in Part II. Regardless, long-term stock market results are bullish when PPI Indicator #2 is favorable and decidedly bearish when PPI Indicator #2 is unfavorable.
PPI Indicator #3: PPI 1-month rate-of-change
The third indicator simply measures the one month percentage change in the Producer Price Index.
A = PPI value this month
B = PPI value last month
C = (A / B) - 1) * 100
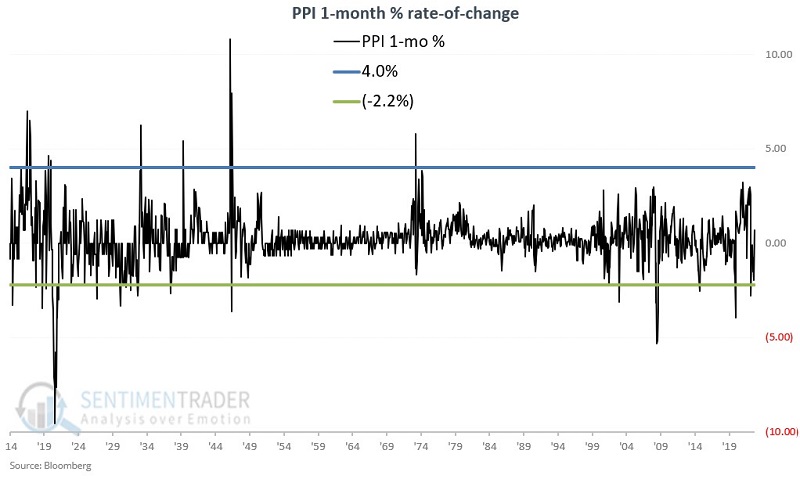
If C is <= +4.00 AND C >= -2.20%, then PPI Indicator #3 is bullish. If C is outside of that range, PPI Indicator #3 is bearish. In other words, if the 1-month percentage change in the PPI value is below +4% and above -2.2%, then PPI Indicator #3 is bullish. Otherwise, it is bearish.
The chart below displays the one month percentage change in PPI and the 4.00 and -2.20 cutoffs.
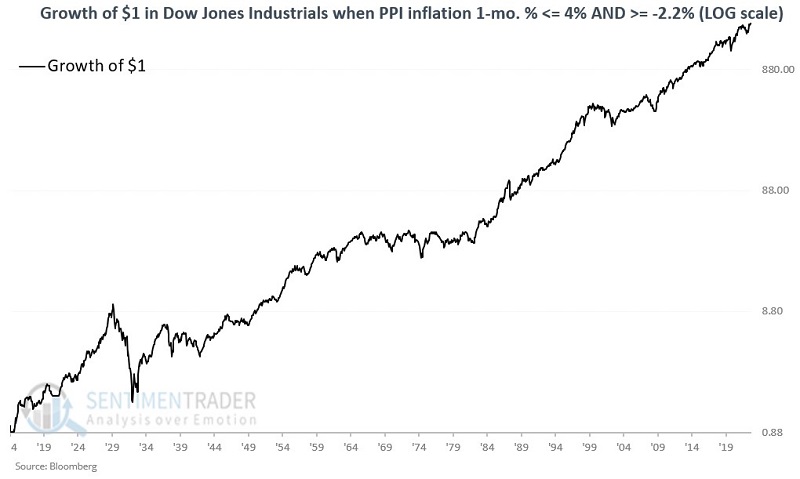
The chart below displays the growth of $1 in the Dow Jones Industrials Index since 1914 if PPI Indicator #3 is bullish. The cumulative growth is +203,131%.
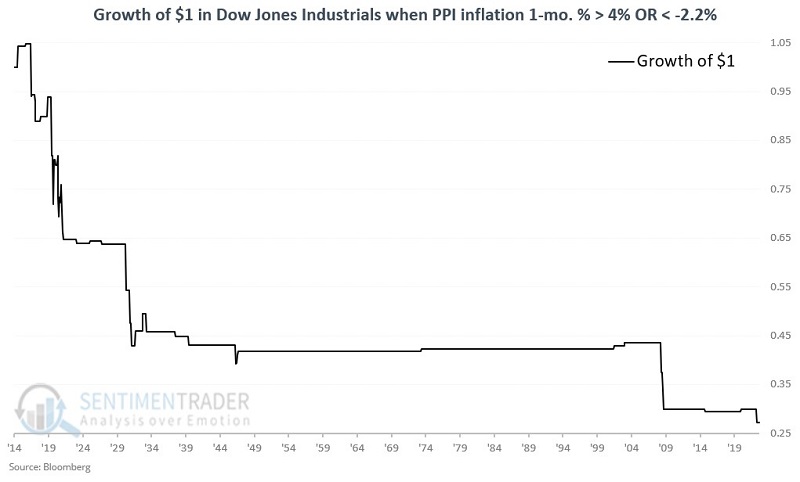
The chart below displays the growth of $1 in the Dow Jones Industrials Index since 1914 if PPI Indicator #3 is not bullish. The cumulative decline is -73%.
The table below summarizes Dow performance based on whether the PPI Indicator #3 ended the prior month bullish or bearish.
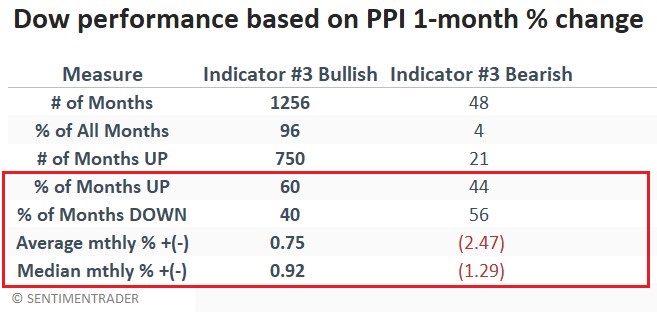
Only 4% of all months fell outside the +4% to -2.2% range. But stock market results during the following month were decidedly subpar, with 56% of those months showing a loss and an average monthly return of almost -2.5%. The bottom line: Big monthly swings in the PPI are not a positive for stocks.
What the research tells us…
Each of the three indicators detailed above highlight the fact that extremes in inflation (or deflation) can have a profoundly unfavorable impact on stocks. But the real power comes not from using these indicators individually but in combination. Part II will detail how to combine these indicators into a single model.