
Potentially significant insider activity in materials, financials and health care

Key points
- Not every blip in corporate insider activity has real meaning, but when buying or selling - or the tradeoff between the two - reaches an extreme, it can have significant implications
- Notable insider action has occurred recently in a variety of sectors
- Most notably, those sectors include materials, financials, and healthcare
A lack of insider selling in the materials sector
Generally, insider buying is considered more important than insider selling. The logic is essentially that insiders may sell for a variety of reasons, but there is only one reason they will commit their own cash to buy shares of their own company in the open market - i.e., they expect the stock to appreciate in value.
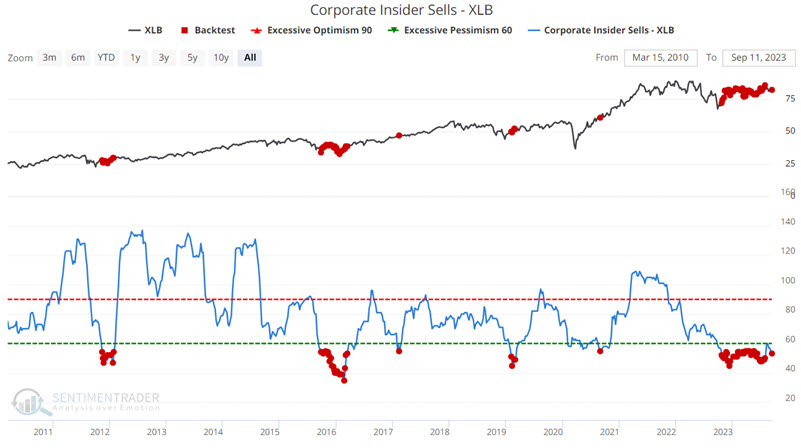
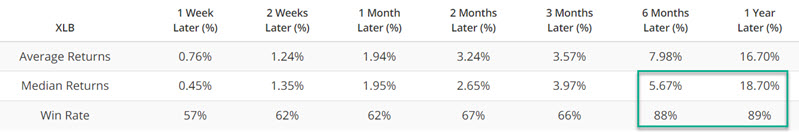
That said, there can be instances when a low level of selling across a sector can flash a favorable signal. The chart and table below display performance for the Materials Select Sector SPDR Fund ETF (ticker XLB) after our Corporate Insider Sells - XLB indicator stood below 56.
Now, let's focus only on those times when this indicator crossed below 56 for the first time in 6 months or more.
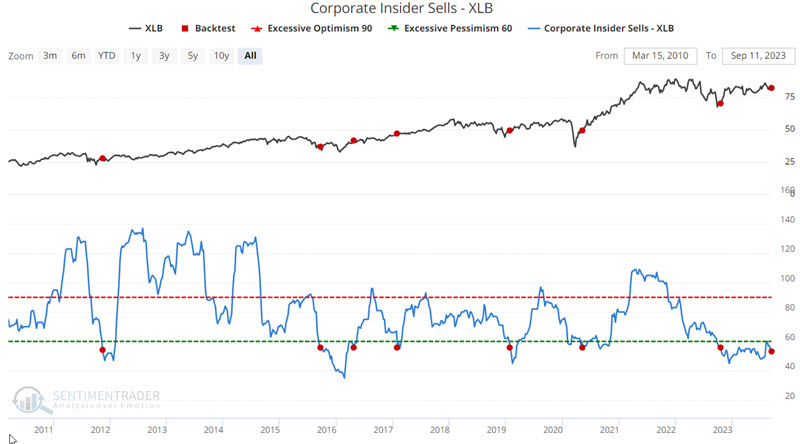
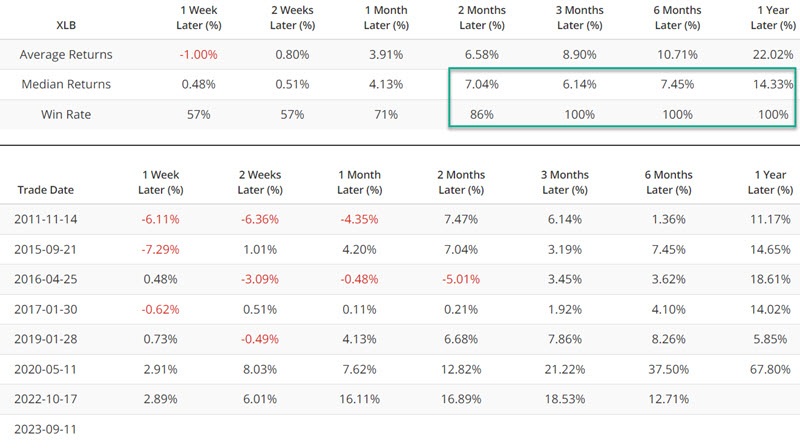
The most recent signal occurred on 2023-09-11. As always, past performance does not guarantee future results. That said, note that 3, 6, and 12-month returns showed a 100% Win Rate during the test period.
Financial sector insiders are still bullish
The financial sector suffered a shock earlier this year when several banks were forced to close. Since that time, financial corporate insiders have been heavy buyers. The tradeoff between buying and selling has once again accelerated of late.
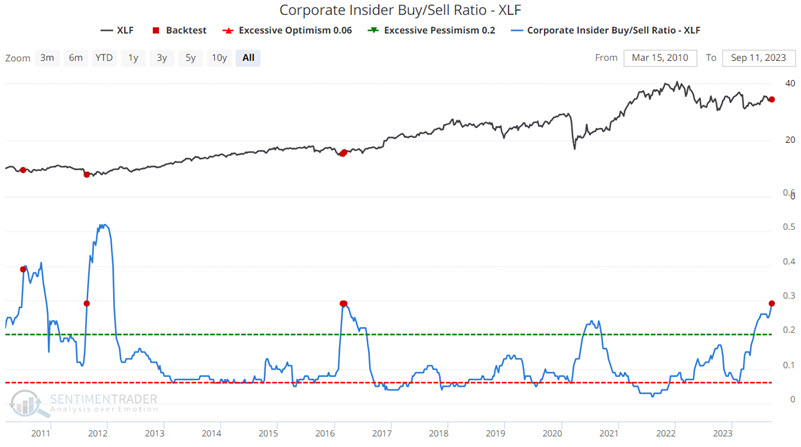
The chart and table below display the action of the Financials Select Sector SPDR Fund ETF (ticker XLF) after our Corporate Insider Buy/Sell Ratio - XLF indicator crossed above 0.29.
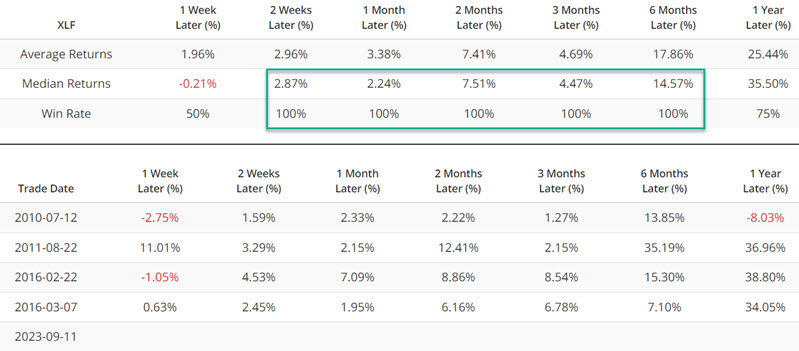
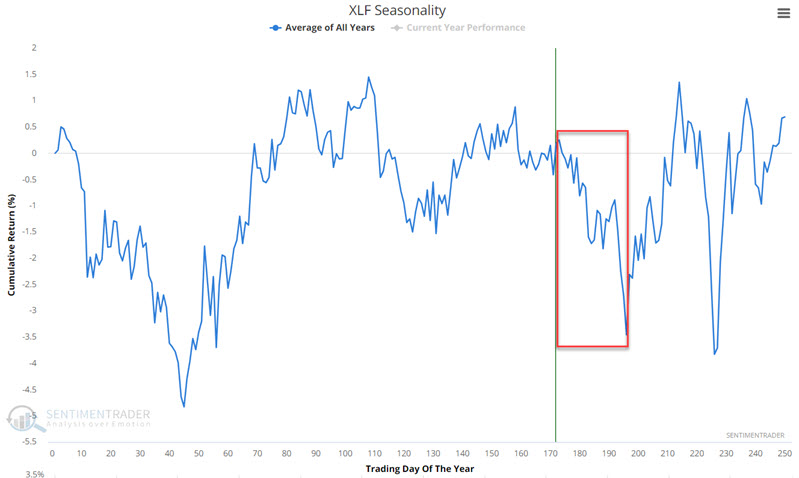
The good news is the high Win Rate from 2 weeks through six months. The bad news is the small sample size and the potential for seasonal weakness in the financial sector in the month ahead. The chart below displays the annual seasonal trend for ticker XLF. It is clear why caution may still be in order in the month ahead. On the other hand, in light of recent financial insider activity, any weakness in the month ahead should likely be viewed as a buying opportunity.
An interesting turnaround in healthcare sector insider action
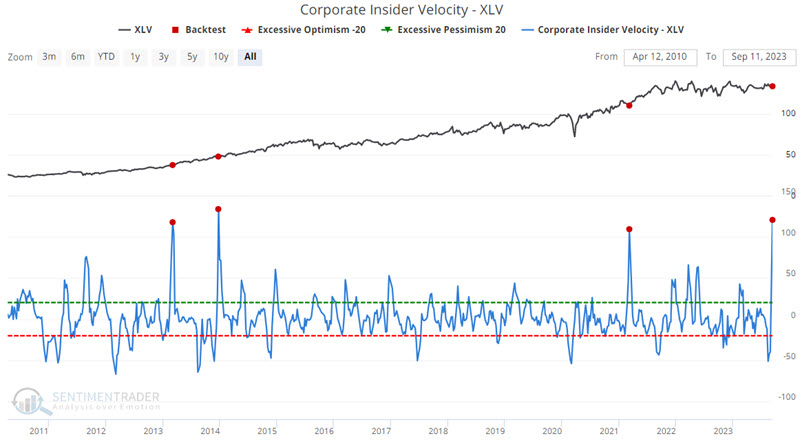
Our Corporate Insider Velocity indicator presents a unique look at insider activity. Our Corporate Insider Velocity - XLV indicator shows the velocity of corporate insider buying versus selling in XLV ETF (health care) stocks. It takes a 4-week rate of change for insider buys and subtracts a 4-week rate of change for insider sales. For this indicator, moves to extreme levels - and reversals from extreme levels - can highlight unique opportunities.
The chart and table below highlight those times when this indicator crossed above -40. The most recent signal occurred on 2023-08-28.
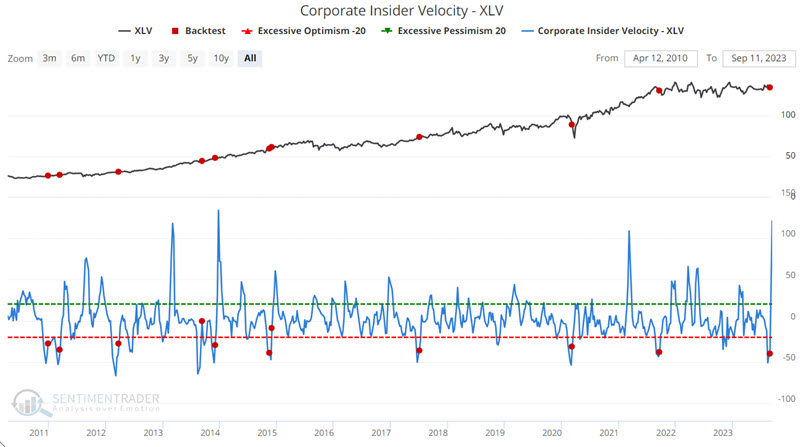
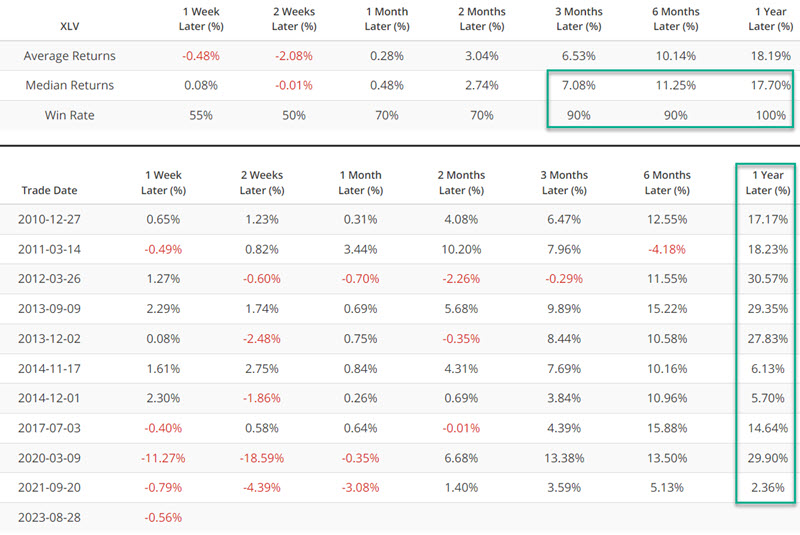
Interestingly, the recent reversal has now spiked above +100. This marks only the fourth time in the past 13 years that this has occurred. While this is a tiny sample size, the results seem noteworthy, as shown below.
The chart and table below highlight those times when this indicator crossed above -100.
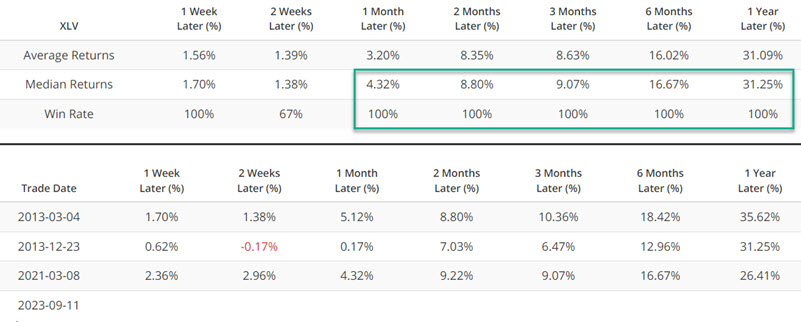
Repeating now, past performance does not guarantee future results. But the primary point is that after a period of relatively lackluster performance for the healthcare sector, sector insiders have moved to the bullish side. This suggests that the people who know their companies best appear to see "better days ahead."
What the research tells us…
Measuring insider buying and selling is pretty straightforward. However, determining the exact implication of each fluctuation in insider activity is an inexact science. Insider actions should rarely be used to generate buy or sell signals automatically. Their best use is as part of a weight of the evidence approach. Materials, financial, and health care have not been market leaders in 2023. The recent action of corporate insiders in those sectors suggests that investors keep a close eye on these sectors for a buying opportunity.