
Potential seasonal opportunities in biotech and Nasdaq index

Key points:
- Seasonal trends should not be thought of as "buy" or "sell" signals
- Seasonal trends should be thought of as "clues" that tell us "When to look where" for potential opportunities
- With that understanding in mind, traders might consider looking more closely at biotech (XBI) and the Nasdaq 100 Index (QQQ) for potential trading opportunities
Biotech (XBI) is in the seasonal sweet spot
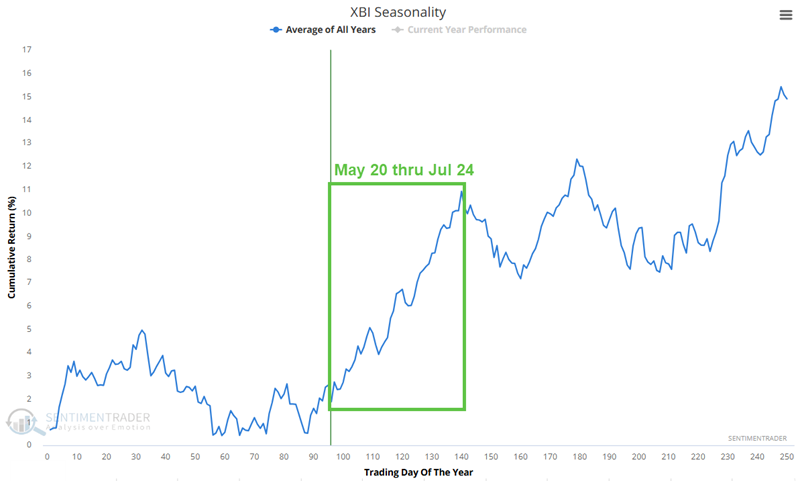
The Annual Seasonal Trend chart for the State Street SPDR S&P Biotech ETF (XBI) suggests a bullish bias for the next several months. The chart below highlights the period from Trading Day of the Year (TDY) #96 through TDY #140. For 2026, this period extends from May 20th through July 24th.
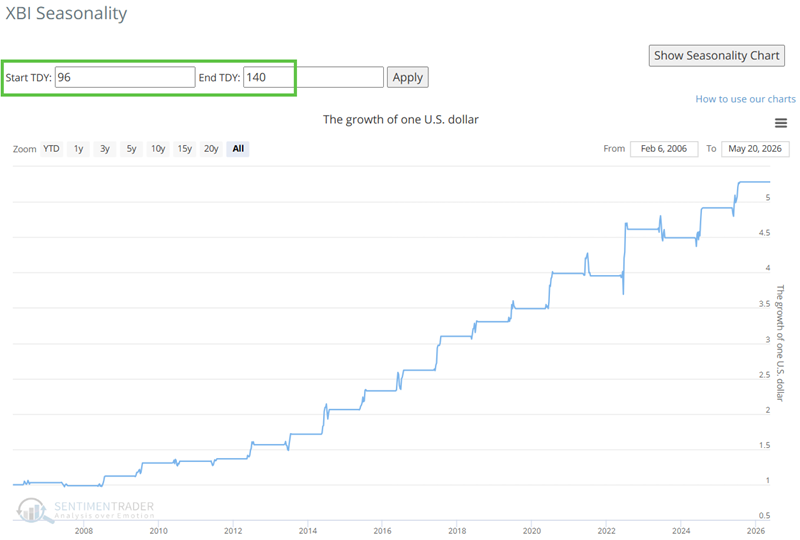
The chart below displays the hypothetical growth of $1 achieved by holding a long position in XBI only during this period every year since 2006
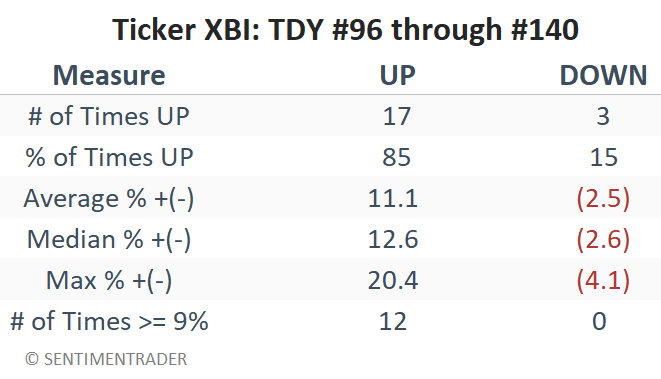
The table below summarizes XBI performance during this period.
Aggressive short-term traders mi