
Potential Seasonal Opportunities for Short-Term Traders to consider

Key points:
- A variety of commodity markets are entering typically reliable seasonal periods; This does not guarantee a particular movement, but it does tell us where to look for opportunities - particularly if price action is in agreement with the seasonal trend
- Wheat, crude oil, and unleaded gasoline are all entering or already in a period of typical price weakness
- Soybeans are in a period of typical strength
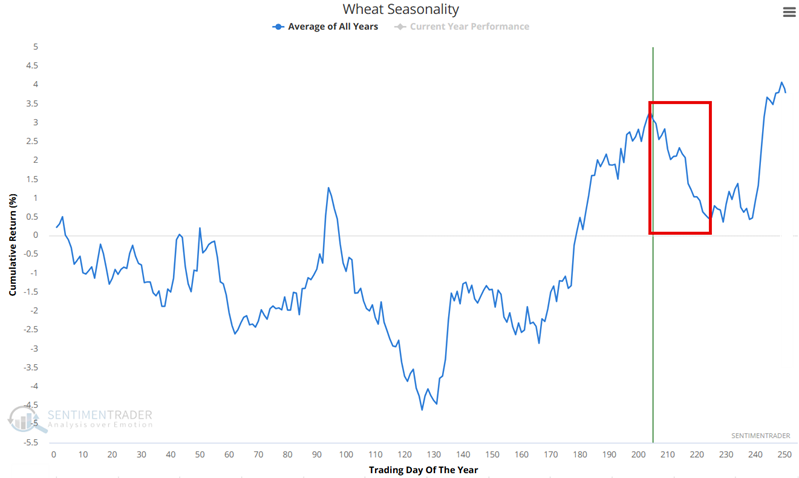
Unfavorable Seasonal Market #1: Wheat
The chart below shows the Annual Seasonal Trend for Wheat futures. An unfavorable period extends from the close on Trading Day of the Year (TDY) #204 through TDY #224. For 2025, this period runs from the close on October 23rd through November 20th.
The chart below displays the hypothetical growth of $1 (based on percentage price movements for Wheat) invested in Wheat only during this period since 1985. The cumulative loss equals -61%.
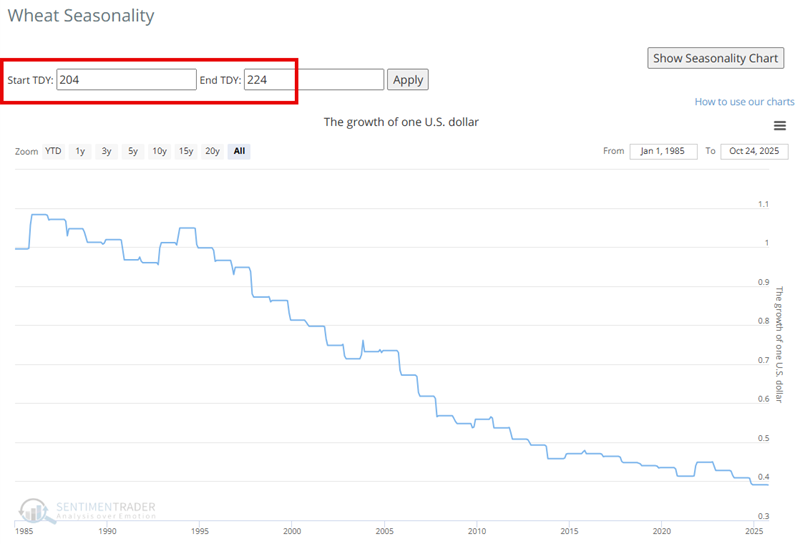
What do you notice about the "growth of one U.S. dollar" chart above (and those below for the other markets highlighted)? It tells us a) that wheat definitely "tends" to show price weakness during this time of year, b) there is no guarantee that it will show weakness during this period in any given year (Sorry, I don't make the rules), and c) you'd better have a compelling reason to attempt to play the long side of this market during this period.
Ultimately, seasonality is a tool I use to tell me "when to look where." But it is rarely an "automatic" trade trigger. Still, the best opportunities tend to arise when price trend action agrees with the expected seasonal trend. The chart below shows that Wheat is presently trading below its 70-day exponential moving average, i.e., in a downtrend. A move back above the EMA would call the trend into question.
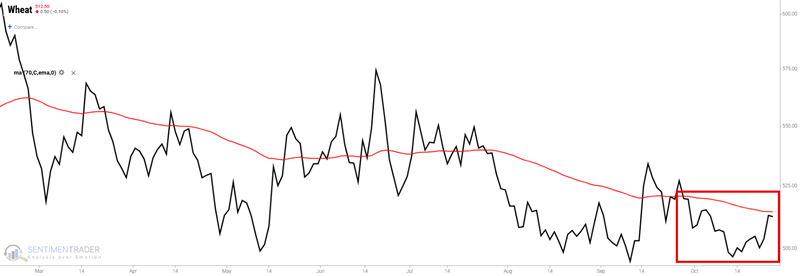
NOTES ON PRICE TREND CONFIRMATION: I use the 70-day exponential moving average as a trend filter, not an automatic trade entry or exit trigger. There is nothing "magic" about 70 days, nor exponential versus simple moving average. It's just something non-standard that I've settled on as a trend filter. You may wish to experiment with your own trend filter to confirm or deny any given seasonal trend. But the gist of the idea is this: As long as Wheat is below its 70-day EMA between TDY # 204 and #224, it is a viable short position candidate.
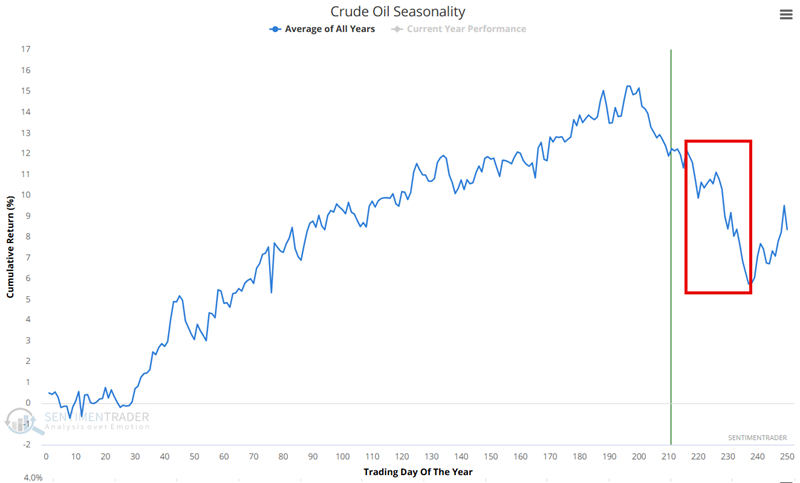
Unfavorable Seasonal Market #2: Crude Oil
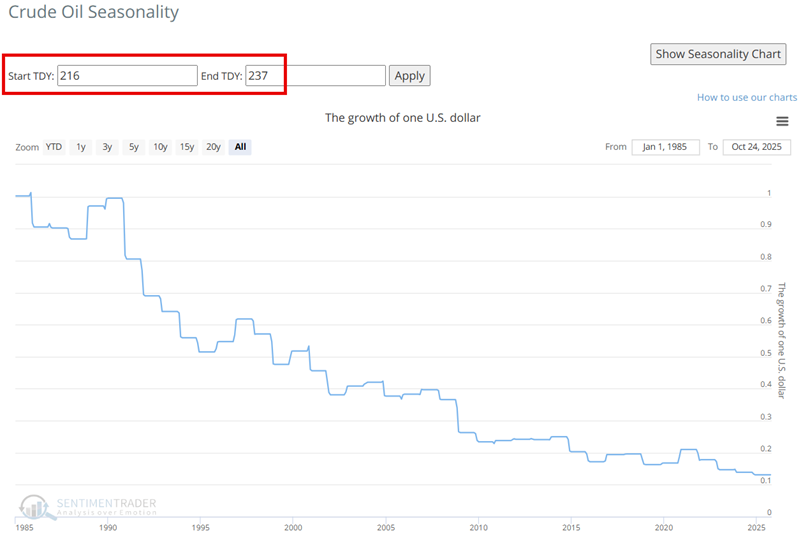
The chart below shows the Annual Seasonal Trend for Crude Oil futures. An unfavorable period extends from the close on Trading Day of the Year (TDY) #216 through TDY #237. For 2025, this period runs from the close on October 31st through December 31st.
The chart below displays the hypothetical growth of $1 invested in Crude Oil futures only during this period since 1985. The cumulative loss equals -87%.
Crude oil is presently in a price downtrend. A move back above the EMA would call the trend into question.
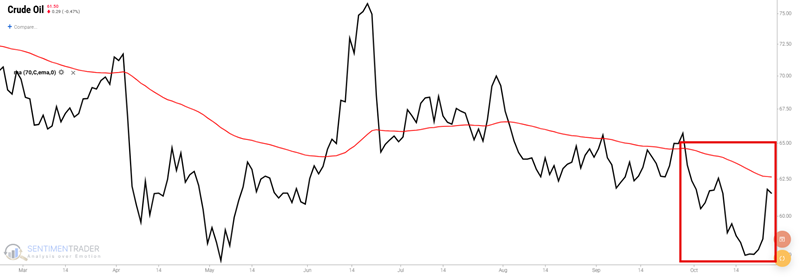
A non-futures trader could consider playing the short side of crude oil using options on the United States Oil Fund LP ETF (USO).
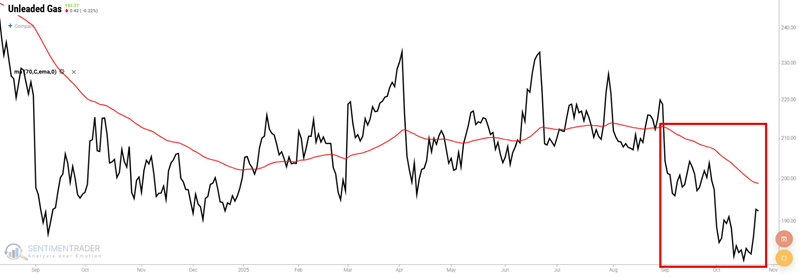
Unfavorable Seasonal Market #3: Unleaded Gas
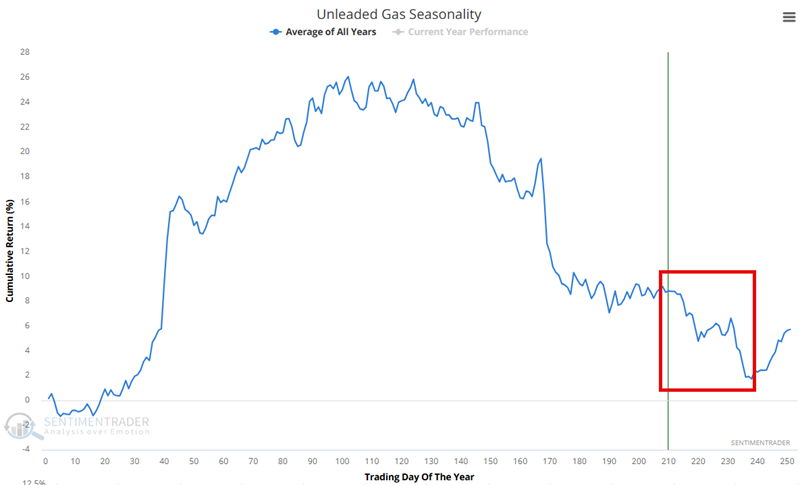
The chart below shows the Annual Seasonal Trend for Unleaded Gas futures. An unfavorable period extends from the close on Trading Day of the Year (TDY) #208 through TDY #238. For 2025, this period runs from the close on October 22nd through December 3rd.
The chart below displays the hypothetical growth of $1 invested in Unleaded Gas futures only during this period since 1985. The cumulative loss equals -78%.
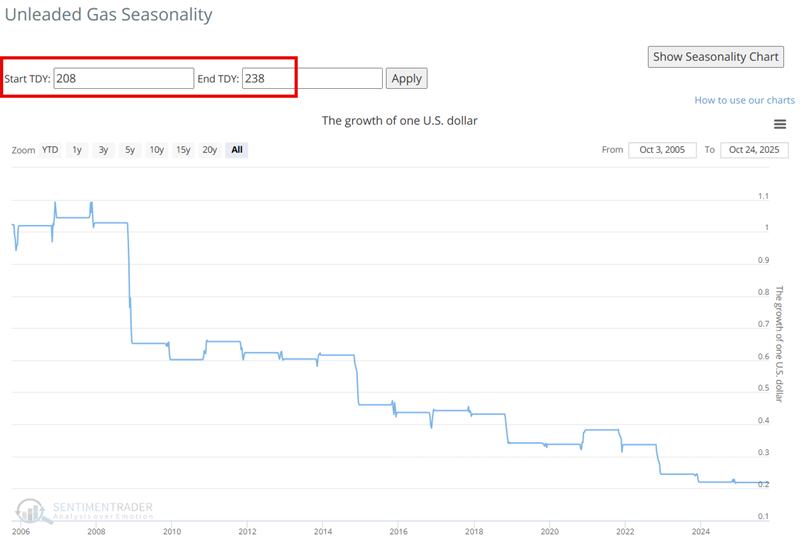
Unleaded Gas is presently in a price downtrend. A move back above the EMA would call the trend into question.
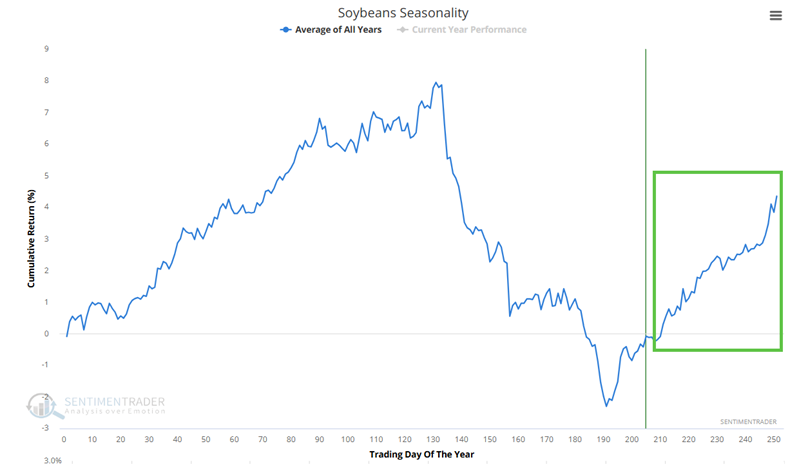
One Favorable Seasonal Market: Soybeans
The chart below shows the Annual Seasonal Trend for Soybean futures. A favorable period extends from the close on Trading Day of the Year (TDY) #208 through TDY #255. For 2025, this period runs from the close on October 29th through December 31st.
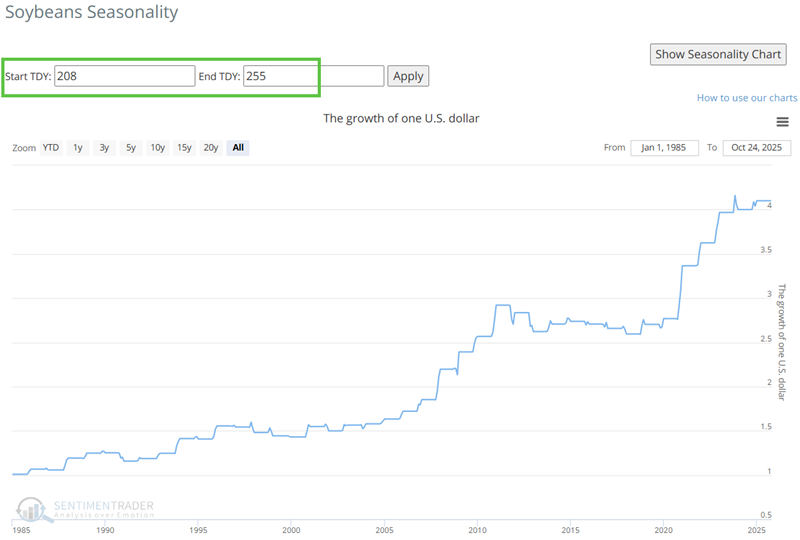
The chart below displays the hypothetical growth of $1 invested in Soybean futures only during this period since 1985. The cumulative gain is +310%.
Soybeans are presently in a price uptrend. A move back below the EMA would call the trend into question.
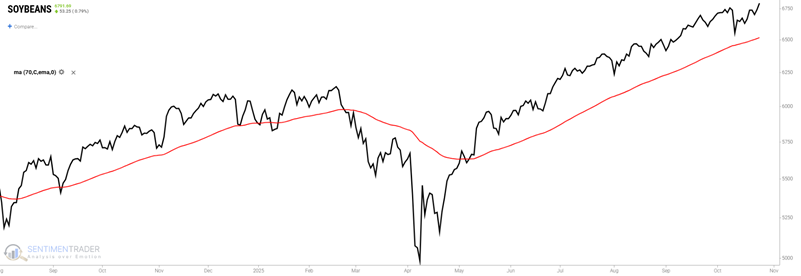
Non-futures traders can consider buying shares of the Teucrium Soybeans ETF (SOYB) for a non-leveraged play on soybeans.
What the research tells us…
As always, seasonality is ultimately a look back at what has happened in the past, not a roadmap of what will happen in the future. As a result, traders must remember that even the most historically persistent seasonal trend can fail the next time around. Therefore, requiring price action to agree with seasonality to confirm a trend can be very helpful in identifying the best opportunities. Likewise, regardless of the setup that triggers any trade, a trader is never relieved of their responsibility to a) intelligently allocate capital (i.e., never "bet the ranch"), and b) ruthlessly manage risk.