
Potential opportunities in beaten down utilities

Key points:
- After eking out a new all-time high earlier this year, utilities have plummeted in the last month
- The utility sector is entering its most favorable seasonal period of the year
- Several other indicators also suggest the potential for a quick reversal of fortune in this typically defensive sector
Concerns linger following a massive selloff
In this piece in early October, Dean dissected the sharp decline in utilities and noted several unfavorable implications. The primary period of concern was for the S&P 500 Index in the first several weeks after the utility sector dropped 15% or more in 21 days.
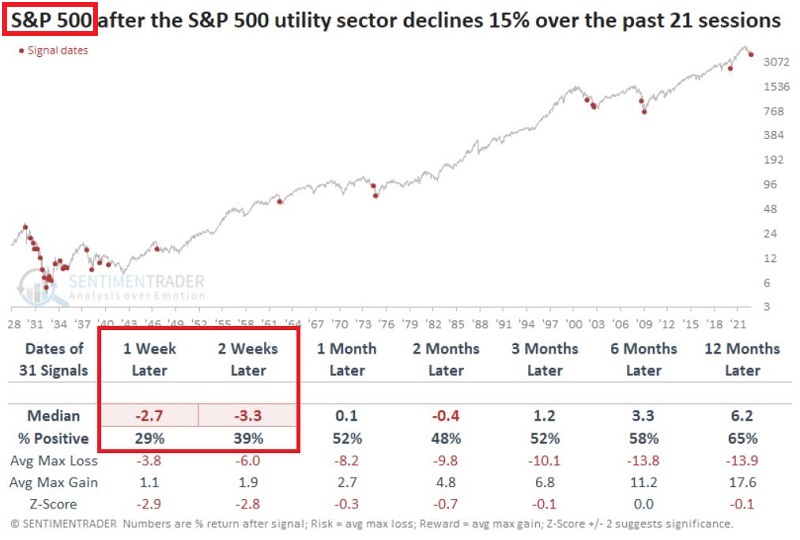
Most utility sector results were more in line with a coin flip.
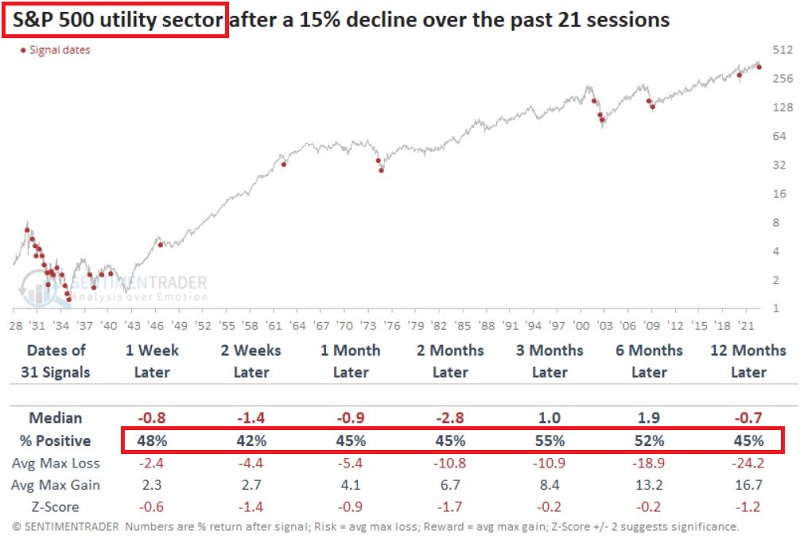
While these results are not inspiring, they also do not preclude the potential for a rebound.
Seasonality flashes green
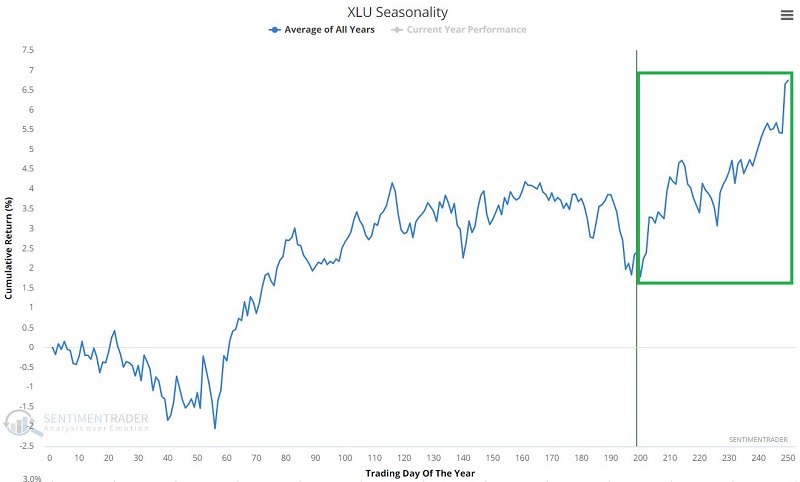
The chart below displays the annual seasonal trend for the Utilities Select Sector SPDR Fund (XLU), which tracks the S&P 500 Utility Sector Index.
The fund just entered a seasonally favorable period that extends from the close on Trading Day of Year (TDY) #200 through the last trading day of the year. This period began on the close of October 18 and will run through December 30.
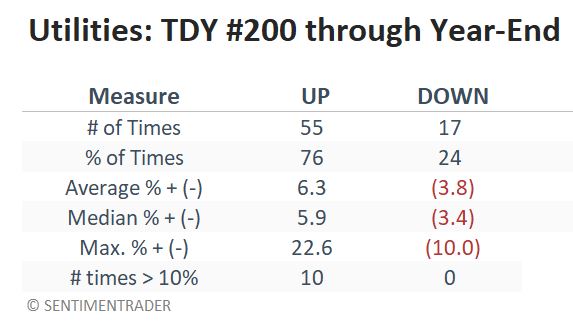
The chart below displays the cumulative percentage return for the S&P 500 Utility Sector Index if held long only during the TDY #200 through the year-end period since 1950.
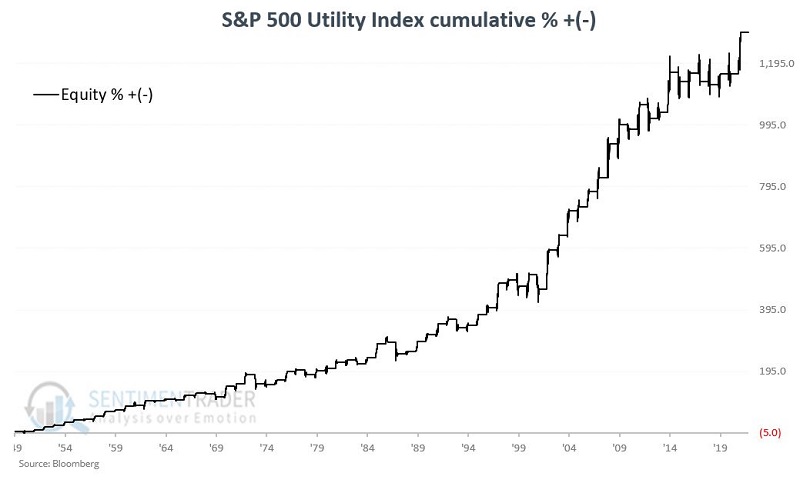
Out of the 72 years in the study period, 55 showed a gain during these seasonal stretches. Returns during the positive years averaged about double the losses during the negative years, and there were ten very large gains versus no very large losses.
Other potential signs of bullish confirmation
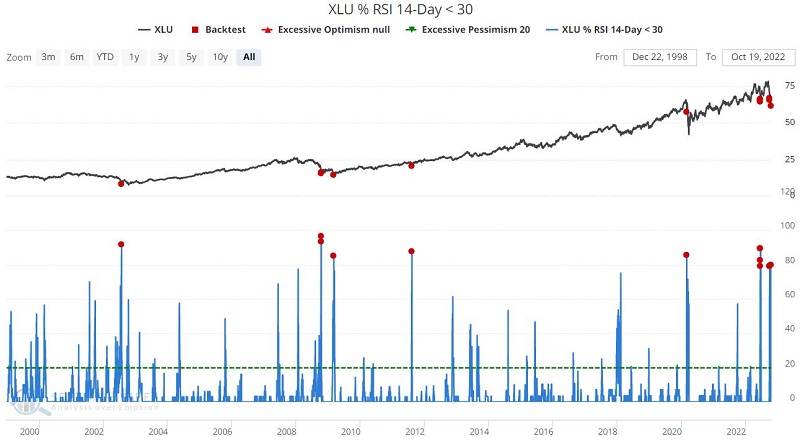
The recent plunge in the utility sector set off several oversold indicators, which have historically been a harbinger of better days ahead for the sector.
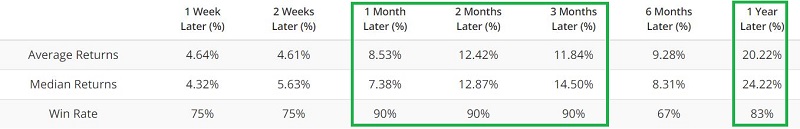
According to the Relative Strength Index (RSI), nearly 80% of utility stocks recently reached an oversold condition, which has preceded gains over the next 1-3 months 90% of the time over the past 22 years.
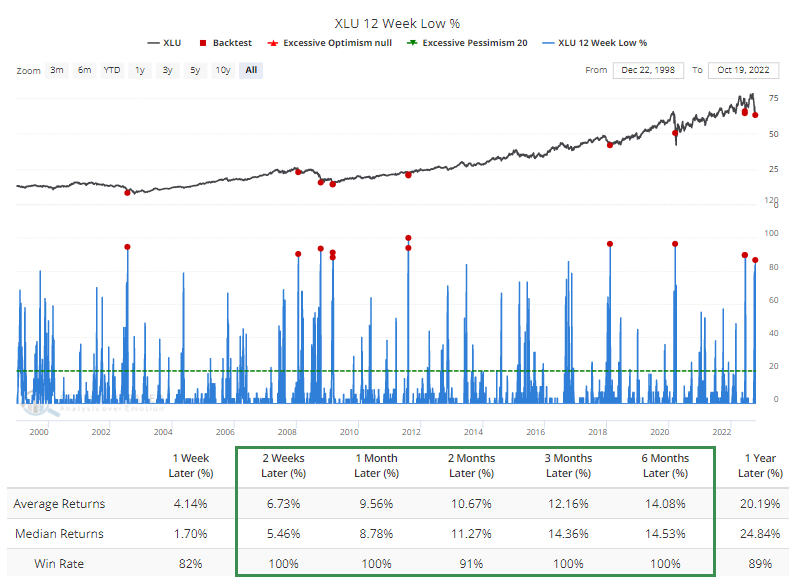
More than 86% of utility stocks recently plunged to at least a three-month low on the same day. That has only triggered during the worst markets, but even so, XLU sported a positive return over the medium term every time.
Lastly, the chart below displays the only three times in the past 22 years when the XLU Component Correlation rose above 0.90. Component correlation measures the degree to which the constituent stocks in a given index trend together. Extremely high readings often occur when an index is plunging sharply, and investors are dumping all stocks in the sector indiscriminately with no regard to the quality of the individual companies.
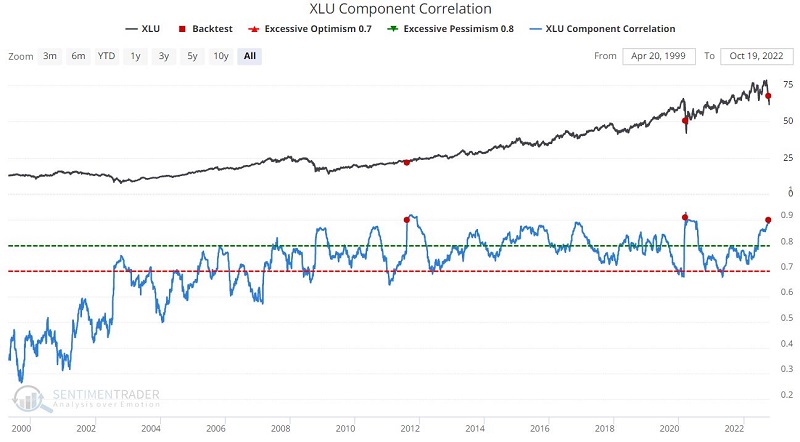
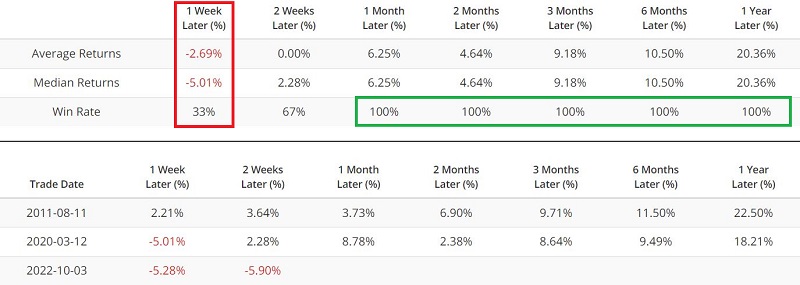
Note that the sample size is too small from which to draw solid conclusions. But also note that this is the type of opportunity extreme readings are designed to highlight and the first two weeks following the latest signal were precisely in line with Dean's findings highlighted above.
With those two weeks of continued selling out of the way, the prospects for utilities now would seem to be improved.
The selloff in bonds may ultimately influence utilities positively
The chart and table below display XLU performance following those times when the 20-day average for our Bond Risk Levels indicator crossed above 2.00 for the first time in six months. This typically only happens after an extended unfavorable period for interest rate-sensitive investments (i.e., bonds and utilities).
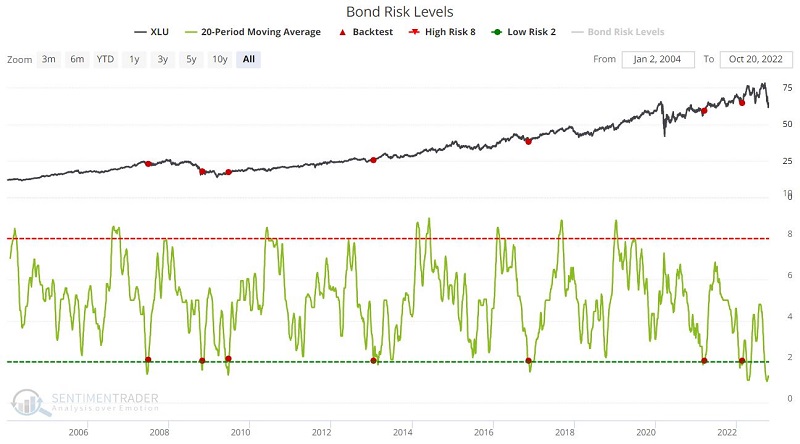
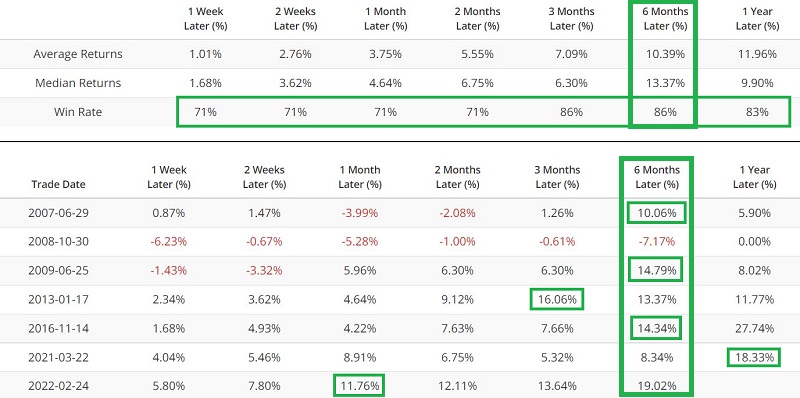
Note in the table below that:
- The six months after a signal showed the most consistent performance results
- Six of the seven signals generated a double-digit return sometime within twelve months after the signal
Another new signal will occur whenever the 20-day average for Bond Risk Levels rises back above 2.00.
What the research tells us…
When a sector gets hit as hard as utilities were in the last month, it typically makes sense to hold off and let the dust settle before jumping in. However, given the deeply oversold condition in this sector, combined with the onset of the most favorable seasonal time of year, utilities appear to be offering an opportunity.