
Potential corporate insider "behind the curtain" signs emerge

Key points
- Our Corporate Insider Velocity indicator is designed to identify subtle - "behind the curtains" - shifts in insider activity that aren't always obvious in looking solely at buying and selling data
- Extremes and/or reversals in corporate insider activity often highlight potential opportunities for alert investors
- There have been several recent developments in the S&P 500 and the technology and utility sectors
Identifying subtle shifts in corporate insider activity
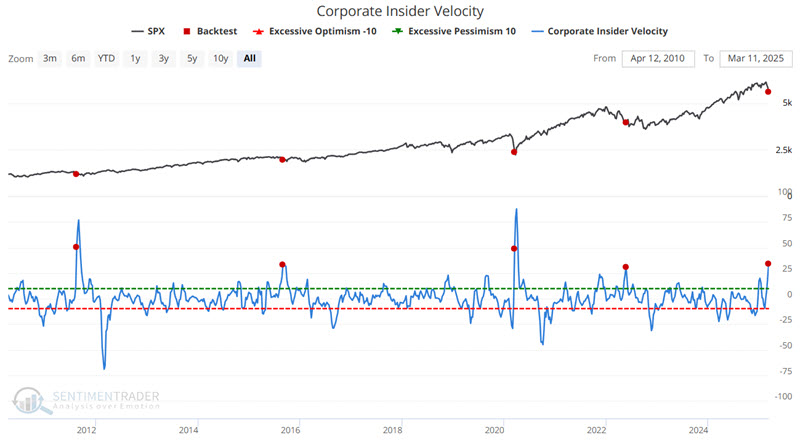
The Sentimentrader Corporate Insider Velocity indicator shows the velocity of corporate insider buying versus selling. It takes the 4-week rate of change for insider buys and subtracts the 4-week rate of change for insider sales. This measurement, at times, offers a "hidden" look at insider activity that is not necessarily apparent in straight "insider buys" and "insider sells." For the record, this indicator is not intended to be used as a standalone trading system. However, it does have a history of offering "early alerts" that few investors see.
The chart below shows our Corporate Insider Velocity indicator, which looks at open market transactions by corporate insiders of the S&P 500 component stocks. The red dots highlight those rare occasions when the indicator value crossed above 30. The most recent signal occurred on 2025-03-10.
The table below summarizes results and shows subsequent S&P 500 performance signal-by-signal performance.
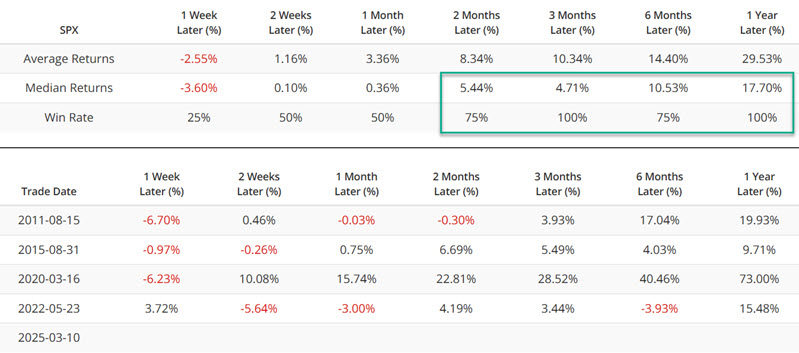
Again, it is important to emphasize that many factors influence the stock market and that a rare signal from a somewhat wonky indicator should not be relied upon solely as a basis for buying stocks. With that caveat and the other regarding minuscule sample sizes in mind, the results are compelling and suggest that investors at least remain open to the bullish case despite recent market weakness.
Now, let's look at even more outlandish results in a few sectors.
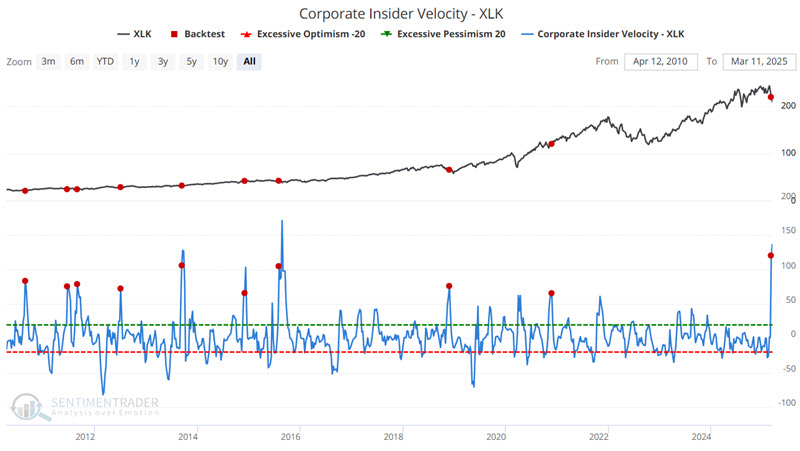
The technology sector
The chart below highlights when the Corporate Insider Velocity - XLK indicator crossed above 65. Note that some signals were early. The most recent signal occurred on 2025-03-03.
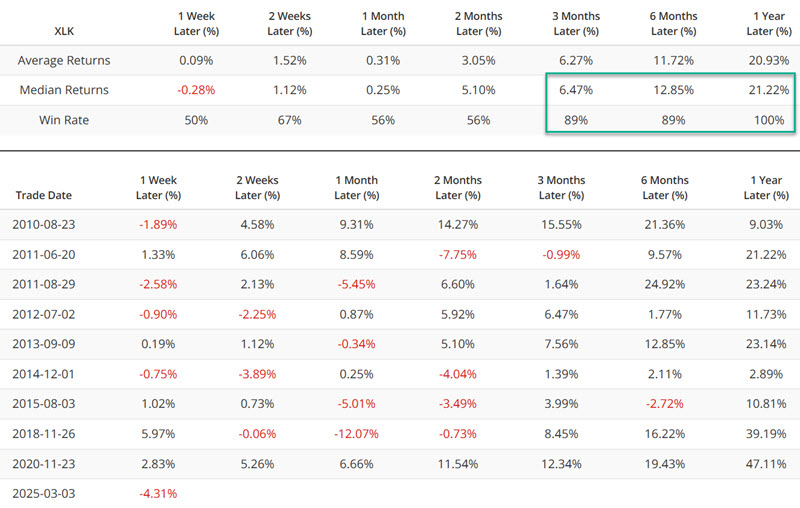
The table below summarizes the results and shows subsequent XLK performance signal-by-signal. The immediate results following the latest signal have been awful, as technology stocks have plunged. Still, three-, six-, and twelve-month historical results are compelling and argue that investors view the decline in the technology sector as a potential buying opportunity.
The utilities sector
The chart below highlights when the Corporate Insider Velocity - XLU indicator crossed above 60. Note that some signals were early. The most recent signal occurred on 2025-03-03.
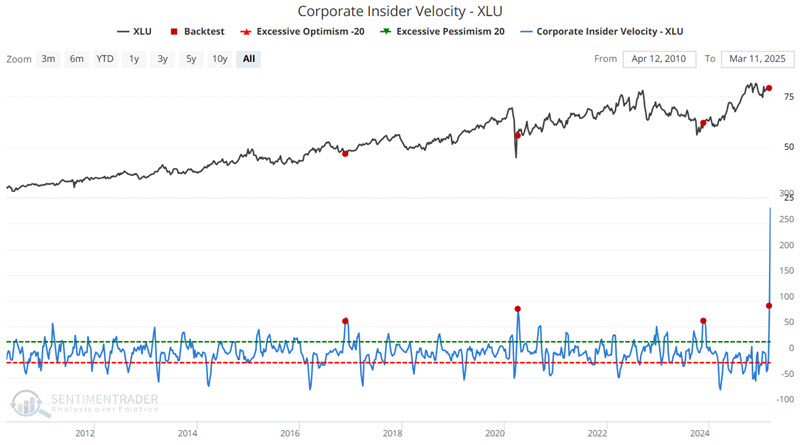
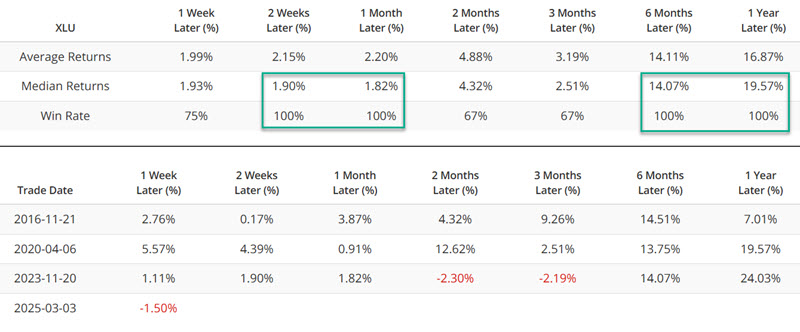
The table below summarizes the results and shows subsequent XLU performance signal-by-signal.
The recent spike in the Utilities Velocity indicator is stunning on its face. But let's take a closer look at how this value came about. Our insider Buys, insider Sells, and Insider Buy/Sell Ratios are based on six months of open market transactions for insiders of companies included in the index in question. They are derived from the insider trading database we receive from Bloomberg.
The chart below shows the Corporate Insider Buy/Sell Ratio - XLU indicator. If we looked solely at this indicator, we would most likely label utility insider activity as unfavorable, as selling has dwarfed buying in the last six months overall.
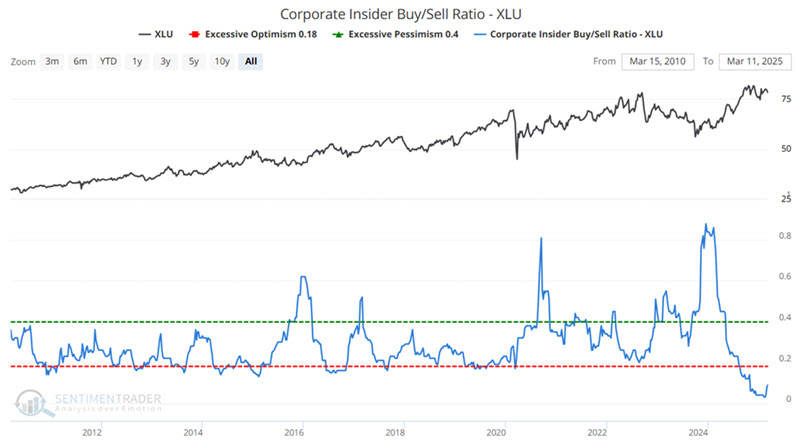
But remember, the Corporate Velocity indicator is designed to highlight subtle - and often early - shifts in buying and selling patterns.
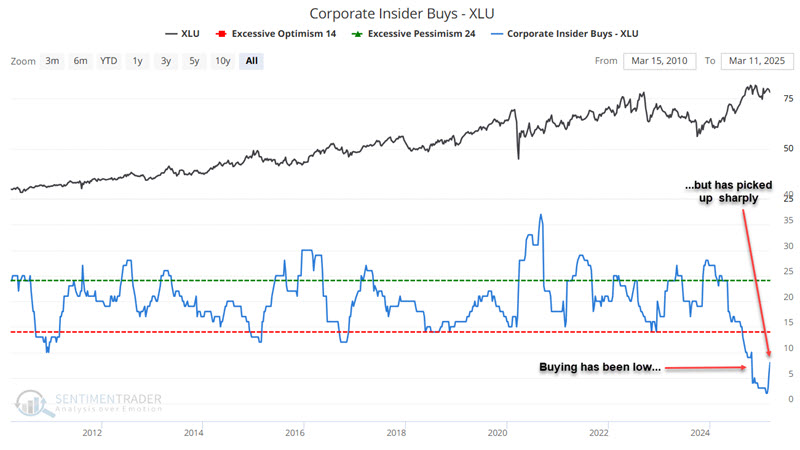
The chart below looks only at utility insider open-market buys. There has been a dearth of buying in the last six months. However, the indicator value has risen 300% in the previous four weeks from a minuscule two to eight.
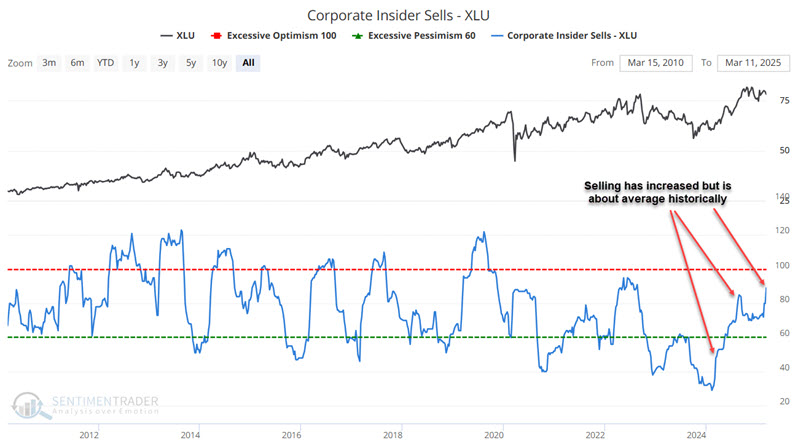
The chart below looks only at utility insider open market sales in the trailing six months. In the last four weeks, the indicator's value has risen from 74 to 89, or 20.3%.
When we subtract the four-week change for sellers (21%) from the four-week change for buyers (300%), we get the Corporate Insider Velocity - XLU indicator value of 279.
Does this shift constitute a "buy" signal in and of itself? Not necessarily. But the history - though small in sample size - suggests that investors should be paying attention.
What the research tells us…
A common mistake for many investors is to expect a given indicator to act as a full-fledged trading system. However, most indicators give information regarding only one factor that might affect a given stock, index, or market. Thus, individual indicators are typically best used not as a standalone trade generator but as part of a process. Conversely, individuals must not consider too many indicators simultaneously to avoid "analysis paralysis." Our Corporate Insider Velocity indicator at time conveys information about extremes and/or reversals in corporate insider activity. As these individuals know their company's prospects best, it can be beneficial to consider their actions as part of a larger strategy.