Products
SentimenTrader Trading Tools
‍
Backtest Engine
My Trading Toolkit
Correlation Analysis
Seasonality
Market Prediction
Indicators & Data API
‍
Proprietary Indicators & Charts
Market Data API
Strategies & Scanner
‍
50+ Trading Strategies
Smart Stock Scanner
Smart Option Scanner
Research Reports
‍
Research Solutions
Reports Library
Free Resources
Simple Backtest Calculator
Simple Seasonality Calculator
The Kelly Criterion Calculator
Sentiment Geo Map
Public Research Reports
Education
Sentiment Indicators
Technical Indicators
Pricing
Company
About
In the News
Testimonials
Client Success Stories
Contact
Log inLoginSign up
< BACK TO ALL REPORTS

Post-Election Jump; No More Oversold Tailwind

Jason Goepfert
2018-11-08
null

This is an abridged version of our Daily Report.

Election excitement

Following the midterm election, the S&P 500 jumped more than 1%, and sector performance showed a strong risk-on bias.

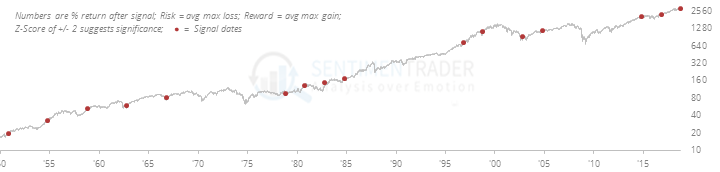
It was the best post-election day rally for the S&P 500 since 1982, which is the only one (midterm or presidential) that managed a larger gain than stocks enjoyed on Wednesday. Similar returns following other major elections since 1950 led to consistent gains in the months ahead, with few (or no) losses over the next 3-6 months.

Back to neutral

After a large pullback from a high and a deep oversold reading in the Relative Strength Index, the S&P 500 has returned to neutral. Now that stocks have recovered a good chunk of the decline, they’re no longer oversold, determined by the Relative Strength Index (RSI). After dropping well below 30, the indicator has finally moved back to neutral territory above 50.

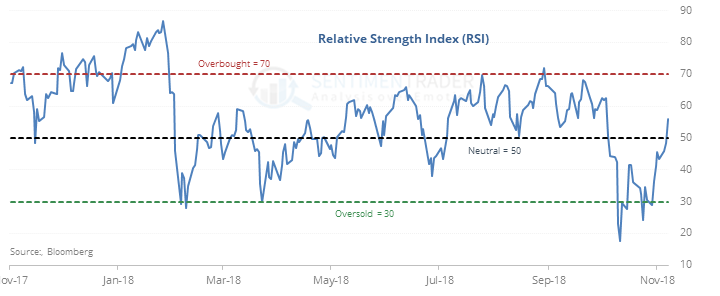
While the lack of oversold readings is no longer a tailwind, the lack of them wasn’t a long-term sell even though the index did tend to pull back over the next two weeks.

More new highs

After more than 30 days with more 52-week lows than 52-week highs on the NYSE, there were finally more highs than lows on Wednesday. After similar recoveries since 1965, the S&P struggled in the shorter-term, with gains over the next two weeks only 41% of the time and an average return of -1.4%.

Oversold volatility

The Optimism Index on VXX is below 13 for the first time in months. According to the Backtest Engine, that has happened on 59 days since 2010.

PRODUCTS
SentimenTrader
Trading Tools
Indicators & Data API
‍
Strategies & Scanner
‍
Research Reports
FREE
RESOUrCES
Simple Backtest
Calculator
Simple Seasonality
Calculator
The Kelly Criterion
Calculator
Sentiment Geo Map
‍
Public Research Reports
‍
Education
Sentiment Indicators
‍
Technical Indicators
‍
Pricing
Bundle pricing
‍
FAQ
‍
Announcements
‍
COMPANY
‍
About
‍
In the News
‍
Testimonials
‍
Client Success Stories
CONTACT
‍
General Inquiries
‍
Media Inquiries
‍
Financial Professionals Inquiries
‍
© 2026 Sundial Capital Research Inc. All rights reserved.
Setsail Marketing
TermsPrivacyAffiliate Program
Risk Disclosure: The information and tools provided are for research and analytical purposes only and are not intended as investment advice. Market analysis involves uncertainty, and outcomes may differ from expectations. Users should conduct their own due diligence and consider their individual circumstances before making any financial decisions. Past performance is not necessarily indicative of future results.

Hypothetical Performance Disclosure: Hypothetical performance results have many inherent limitations, some of which are described below. No representation is being made that any account will or is likely to achieve profits or losses similar to those shown; in fact, there are frequently sharp differences between hypothetical performance results and the actual results subsequently achieved by any particular trading program. One of the limitations of hypothetical performance results is that they are generally prepared with the benefit of hindsight. In addition, hypothetical trading does not involve financial risk, and no hypothetical trading record can completely account for the impact of financial risk of actual trading. for example, the ability to withstand losses or to adhere to a particular trading program in spite of trading losses are material points which can also adversely affect actual trading results. There are numerous other factors related to the markets in general or to the implementation of any specific trading program which cannot be fully accounted for in the preparation of hypothetical performance results and all which can adversely affect trading results.

Testimonial Disclosure: Testimonials appearing on this website may not be representative of other clients or customers and is not a guarantee of future performance or success.