
Positive Signals Emerge for the Hang Seng Index (HSI), but Short-Term Volatility Risks Warrant Attention

Key Points:
- HSI internal breadth expands significantly, a historically long-term positive signal.
- A refined model suggests the HSI may be in a "strong consolidation" phase with favorable historical returns.
- "Dr. Copper," a barometer for China's economy, signals stabilization after a panic sell-off.
- Despite multi-dimensional support, short-term volatility is a risk; past performance is not indicative of future results.
Deep Structure Underlying Expanded Market Breadth
We have seen this scenario before: after a period of stagnation, Chinese stock markets sometimes exhibit strong momentum, but the sustainability of this momentum is often a focus of market attention. Currently, the internal dynamics of the HSI are revealing some rarely seen positive signals in history.
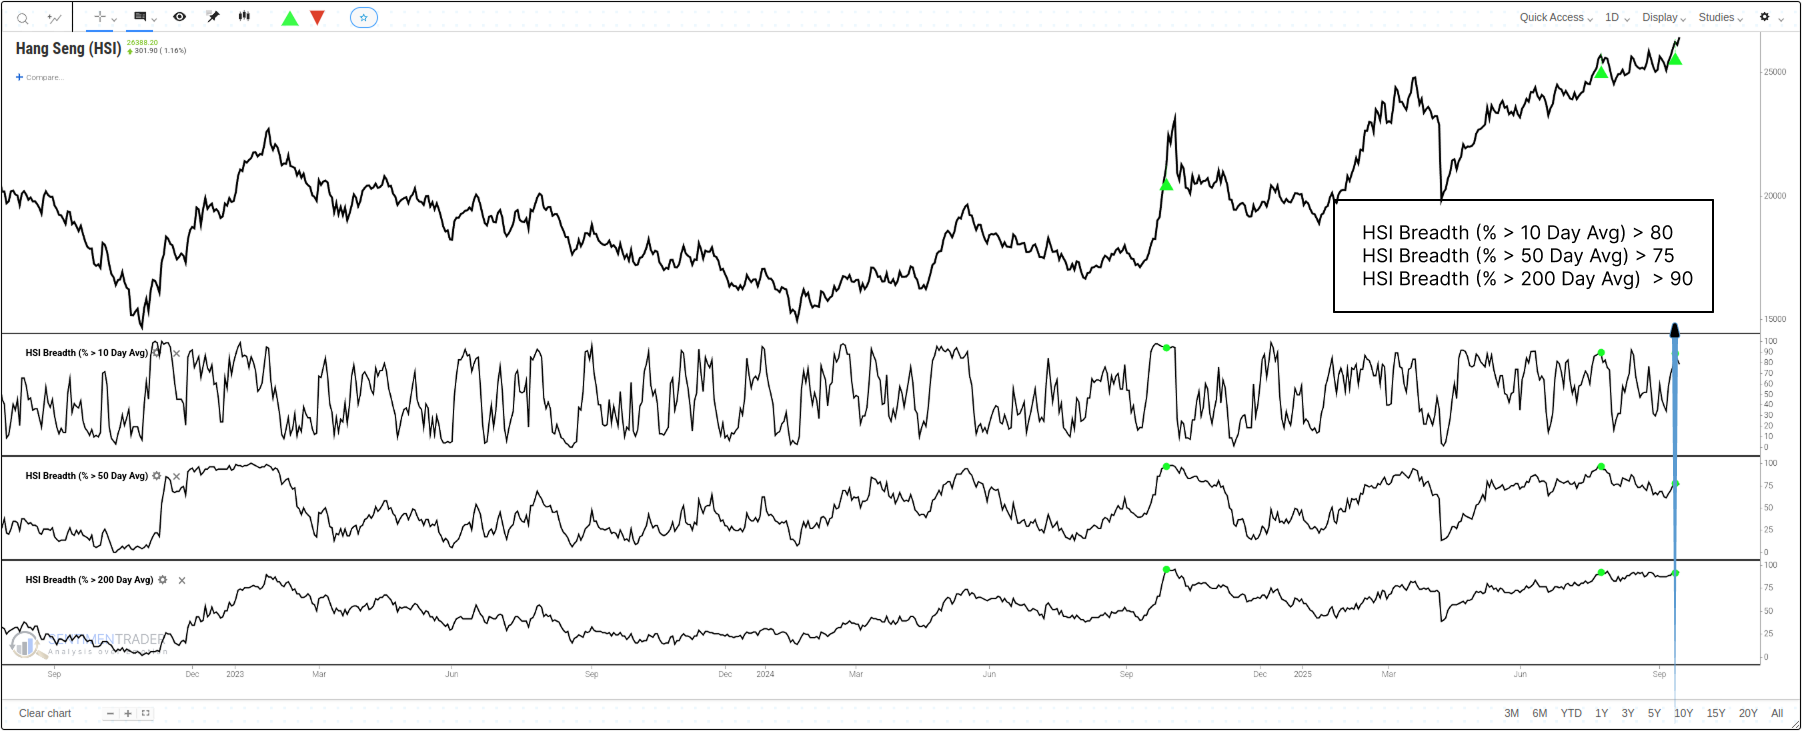
Notably, market breadth has expanded extremely recently. We once again observed that over 90% of HSI constituents are trading above their 200-day MA, while more than 75% are above their 50-day MA and more than 80% are above their 10-day MA. (click here to load the test, then click the Run Backtest button)
This represents a "breadth saturation" state, marking extremely high market participation. However, after such explosive rallies, markets often struggle to maintain short-term momentum.
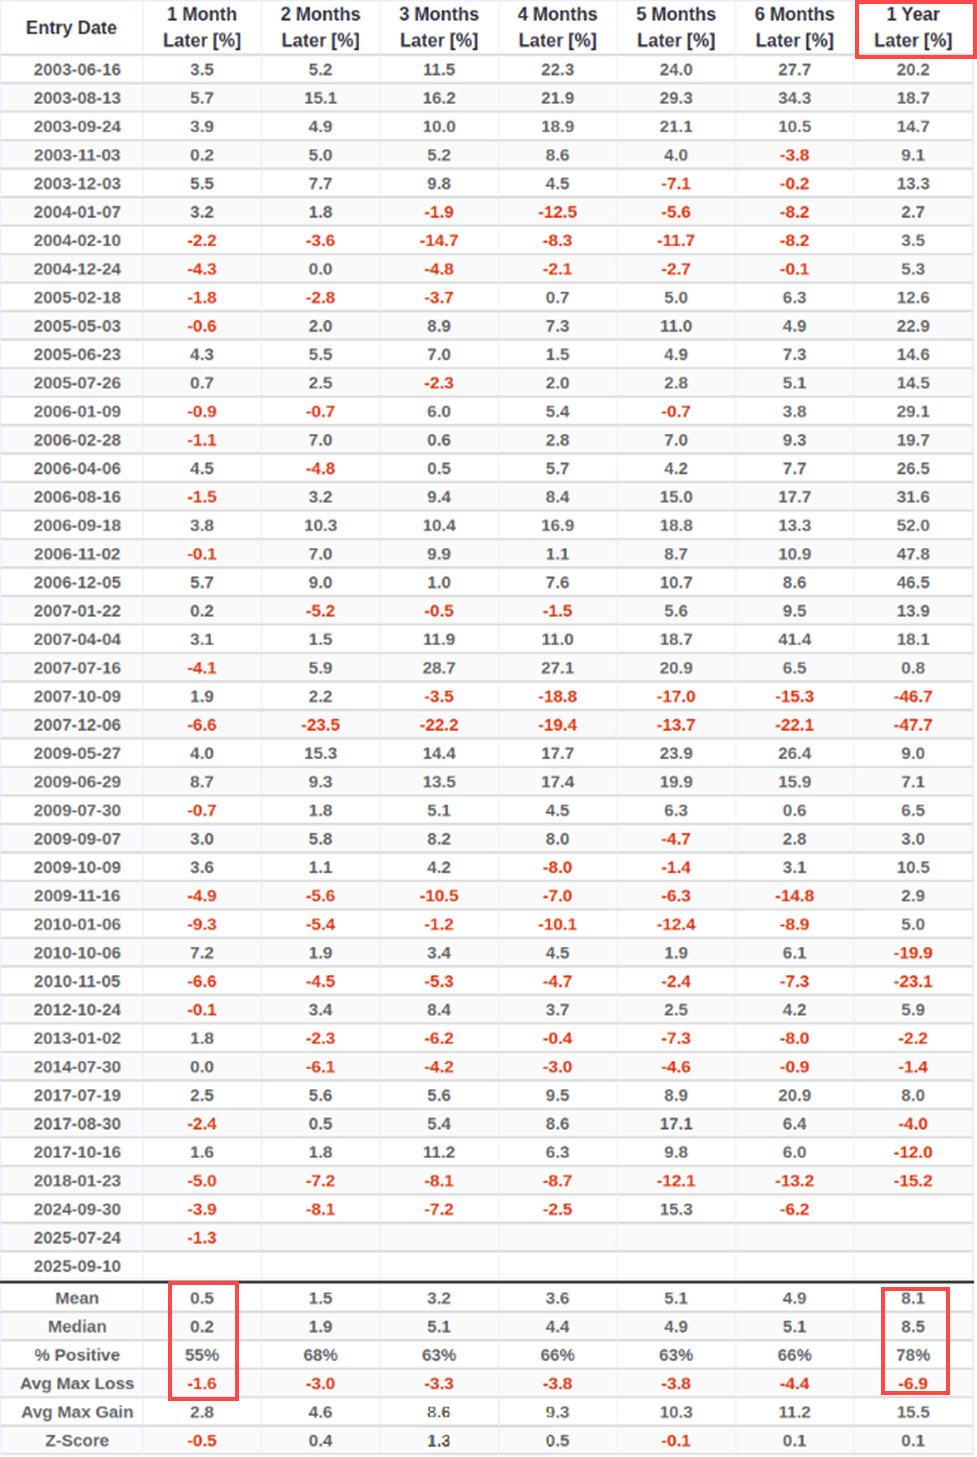
According to revised backtesting data, when this signal is triggered, the median return over the next month is close to zero (+0.2%) with a win rate of only 55%.
Nevertheless, when extending the observation horizon, the historical win rate rises to 78% after one year. It is worth noting that prior to the current signal, the two signals triggered in July 2025 and September 2024 still show negative returns to date - a reminder that we should closely monitor short-term market volatility.
Internal Structure Reveals a "Strong Consolidation" Pattern
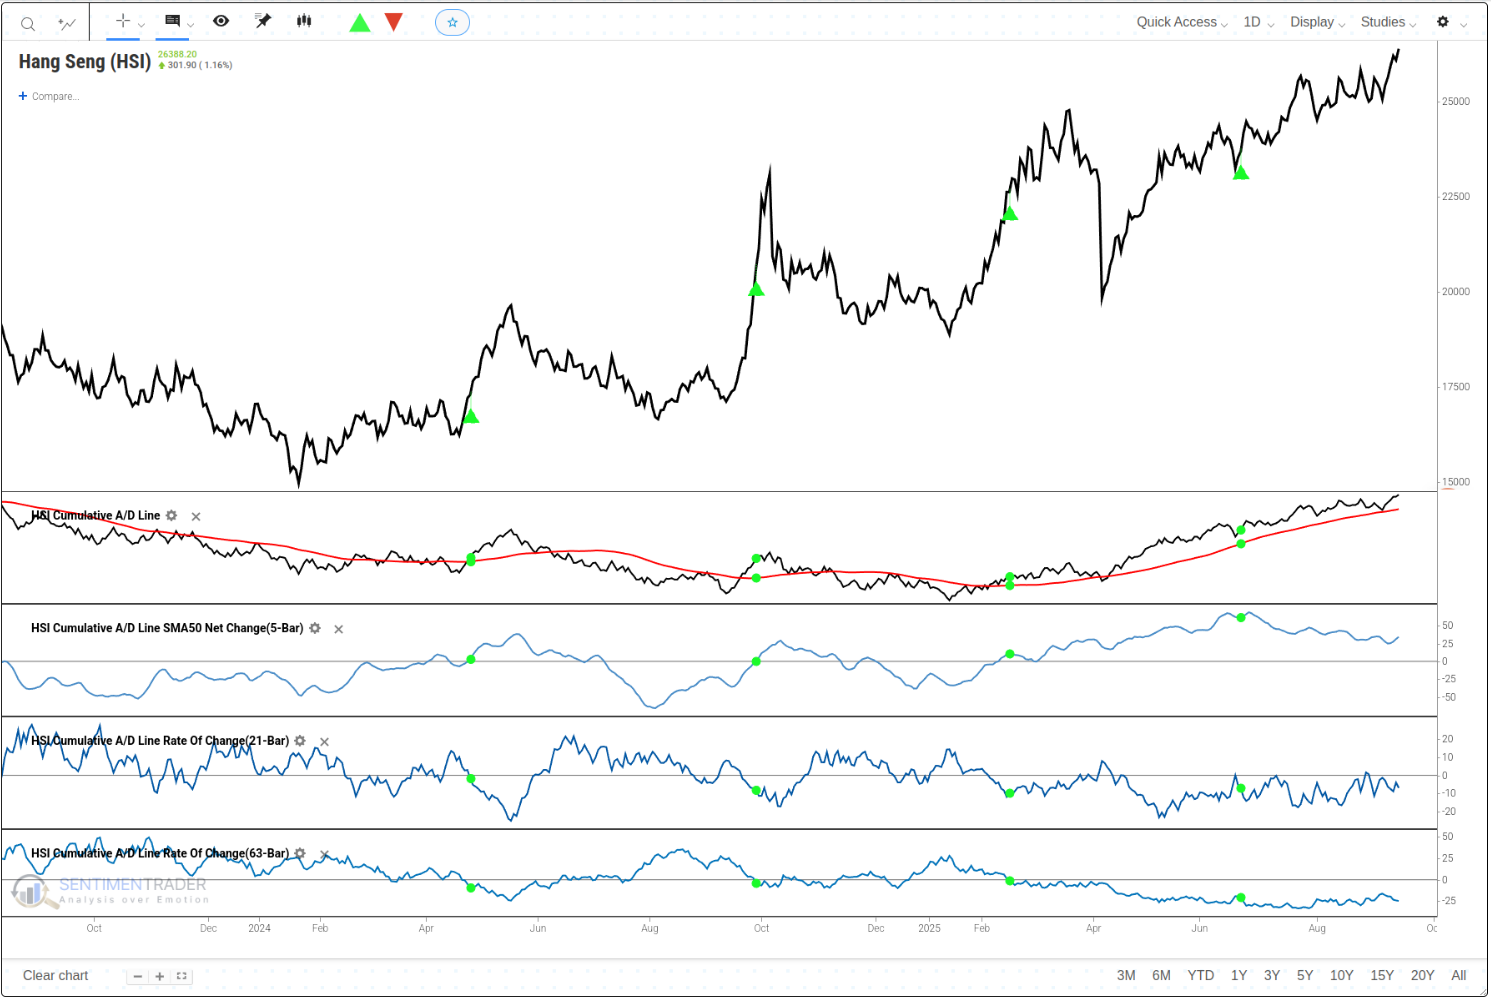
After a strong rally, whether the market can undergo healthy consolidation is key to assessing its subsequent direction. To identify opportunities within such "strong consolidation," we have developed a quantitative model based on the cumulative Advance-Decline (A/D) Line.
This model specifically targets moments where "mid-term trends show signs of improvement (A/D Line > rising 50-day MA), yet short-term and mid-term momentum have pulled back."(click here to load the test, then click the Run Backtest button)
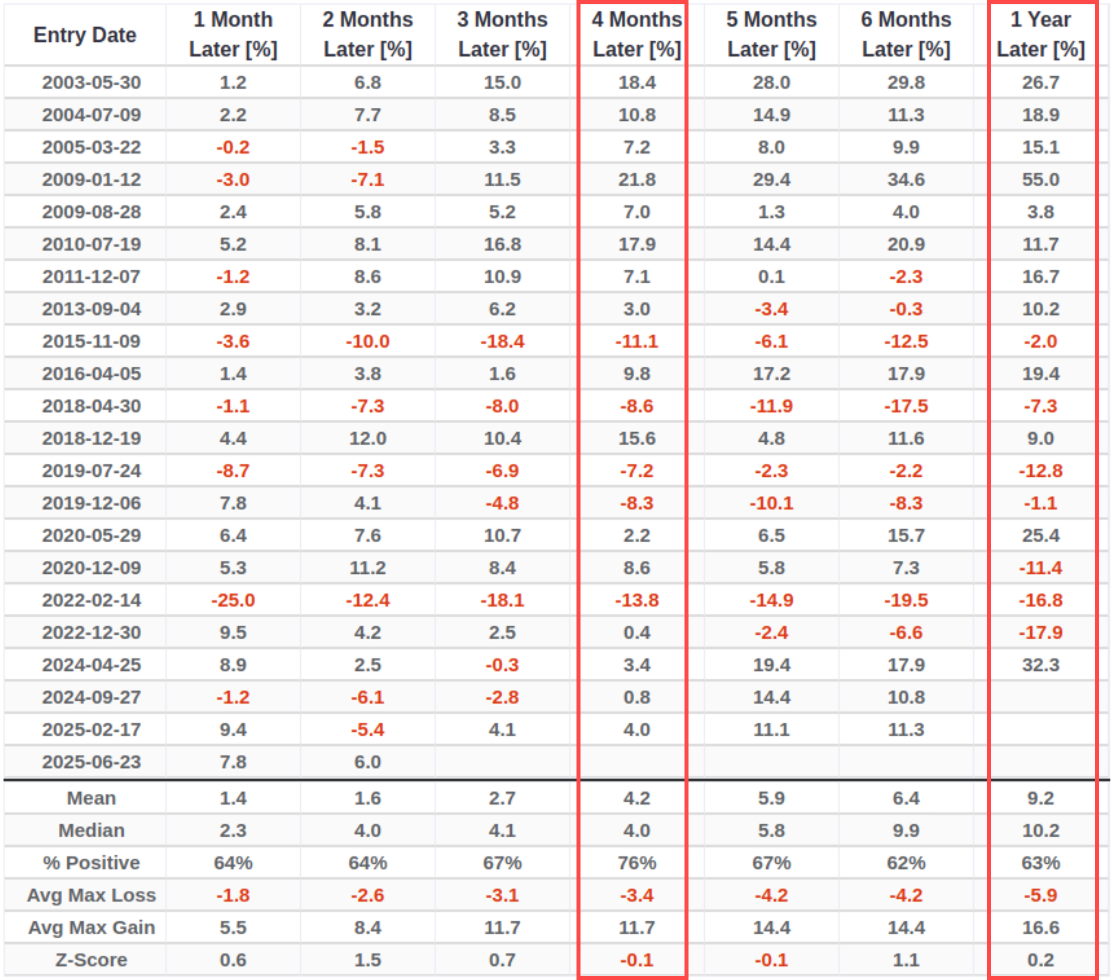
According to the latest backtesting data, this is a noteworthy signal. Over a 4-month holding period, the historical win rate peaks at 76%, with median returns of 9.9% over 6 months and 10.2% over 12 months.
Its historical risk-reward profile is also prominent, with average profits significantly exceeding average losses. However, it should be noted that this signal has also experienced several notable pullbacks in market environments since 2015.
Corroboration from "Dr. Copper"
Beyond internal market indicators, signals from the commodities market also provide interesting corroboration. Due to its close link to China's economy, copper prices are known as "Dr. Copper."
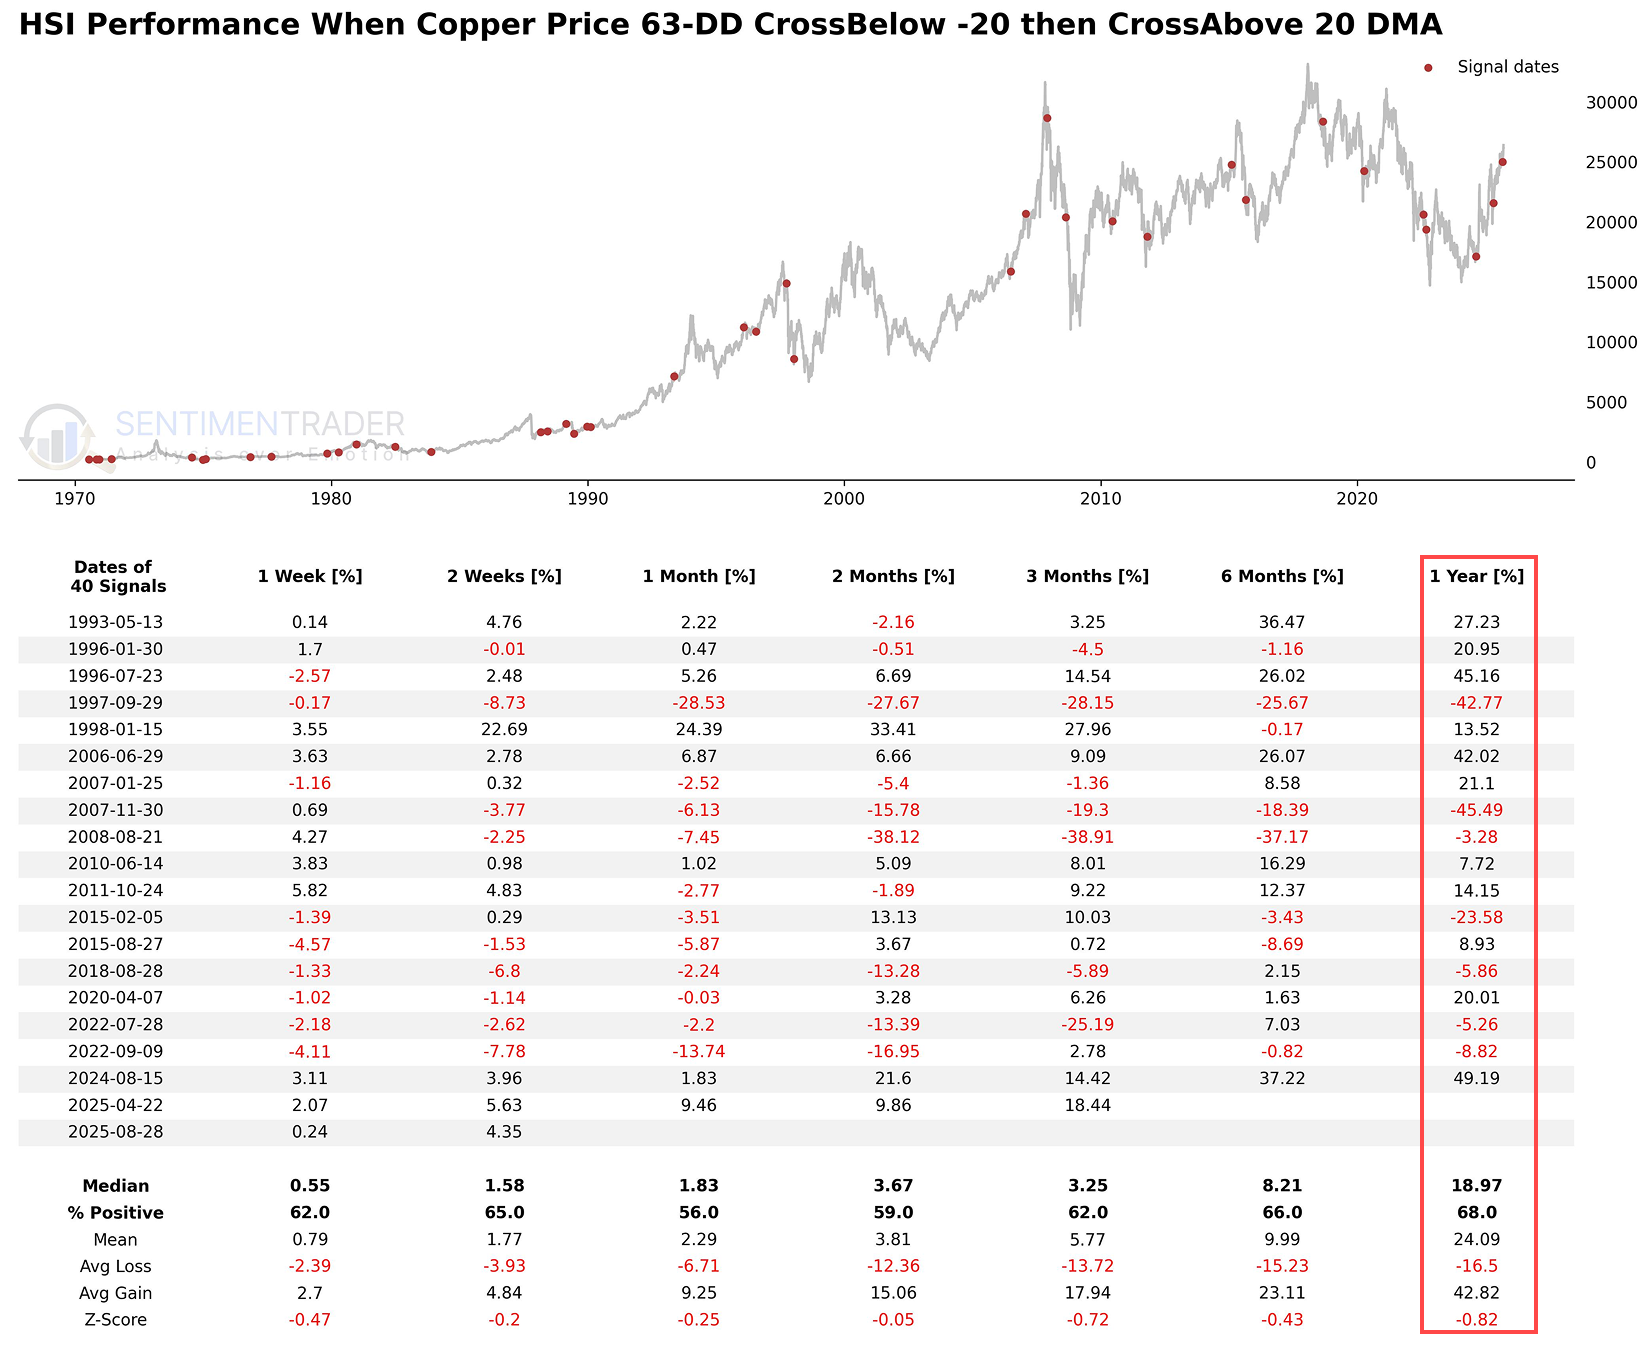
We have designed a model to capture key turning points where market sentiment shifts from panic selling (defined as a 63-day rate of change (ROC) below -20%) to initial stabilization (price breaking above the 20-day MA).
The logic behind this "bottoming after a washout" signal is to identify the first signs of renewed market confidence following the release of extreme pessimism.Furthermore, previous reports have reached similar conclusions.
Historical data shows that the emergence of this signal has often correlated with positive performance of the HSI. After copper prices send this signal, the median 1-year return of the HSI reaches +18.97% with a win rate of 68%. Additionally, its historical average profits far exceed average losses, demonstrating favorable risk-reward characteristics. (click here to load the test, then click the Run Backtest button)
What the Research Tells Us...
Chinese stock markets often follow unique logic, and the reference value of historical patterns varies over time. However, when evidence from multiple dimensions begins to point in the same direction, it typically merits closer attention.
Here is the current situation: The market has recently triggered another historical-level breadth expansion signal, which provides a positive long-term backdrop for market sentiment - though the instability of its recent performance reminds us that additional corroboration is needed. A more robust internal consolidation model (A/D Line signal) suggests the market may be in a state with favorable historical mid-term return expectations, and its most recent signal has performed well. An important external macro reference indicator (copper prices) has also just sent a stabilization signal, aligning with the positive internal signals.
Taken together, these signals collectively paint a constructive technical picture. While historical data offers positive references for mid-to-long-term trends, investors should note that past performance does not guarantee future results. The emergence of these signals suggests the market may be entering a critical turning point worthy of close monitoring, and its subsequent evolution will be of great importance.