
PortfolioEdge Update for May 26

Key points:
- Stocks are seeing some signs of stabilization and potential bottoming pattern
- This comes on the heels of historic selling pressure and extremely stretched sentiment
- Bonds, and more speculative areas of the market, are also seeing nascent signs of calming down
Commentary
Not much has changed. This remains one of the toughest markets I've ever witnessed or studied, but at least there seem to be some nascent signs of stabilizing. The setup remains good for decent risk/reward to the upside, and so far, the price action is confirming.
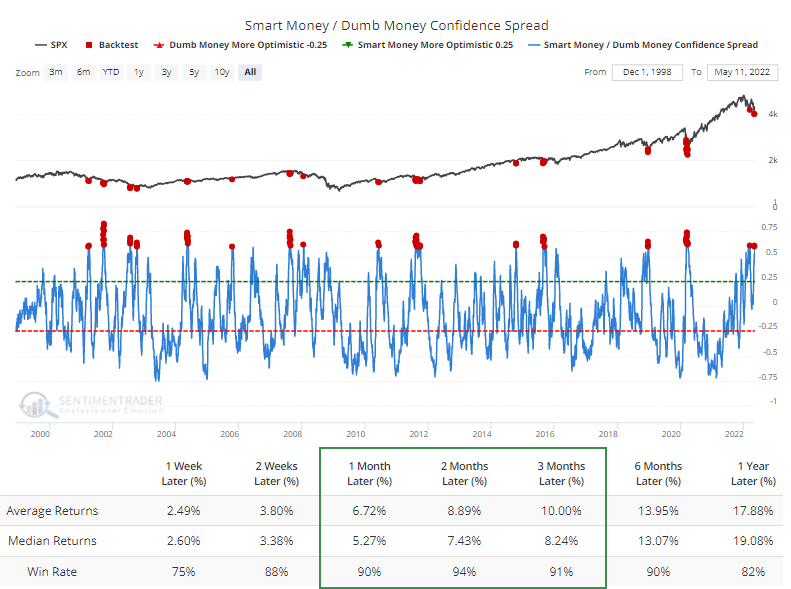
Most notably, we've been highlighting the extreme sentiment readings in recent research. During bear markets, sentiment needs to reach a true extreme to be effective, and it has with a wide spread between Dumb and Smart Money Confidence.
The Backtest Engine shows that similar readings occurred during protracted bear markets. Even so, the S&P 500 sported a positive return over the next two months after 82 out of 87 days. The losses were all small: -1.2%, -2.3%, -0.7%, -1.0%, and -1.5%.
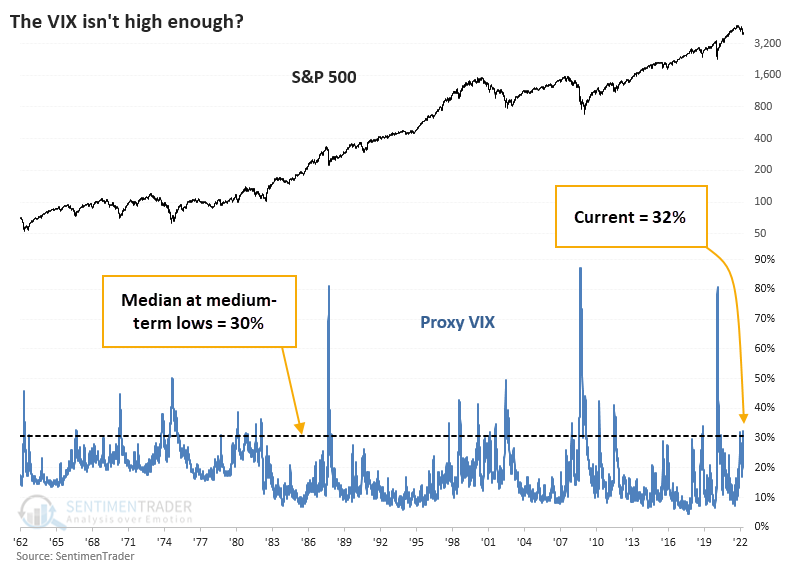
The biggest knock against a sentiment extreme is the idea that investors haven't capitulated yet, and most point to a relatively subdued VIX "fear gauge."
We've shown a Proxy VIX in the past that uses a handful of mathematical models to estimate what the VIX would have been before its inception. As of the end of last week, the proxy was at 32%. If we go back to 1962 and look at every date when the S&P 500 fell to a one-year low, and that was the lowest price for at least the next three months, the median Proxy VIX was 30%. So, according to this version, fear is higher than it has been at most medium-term troughs.
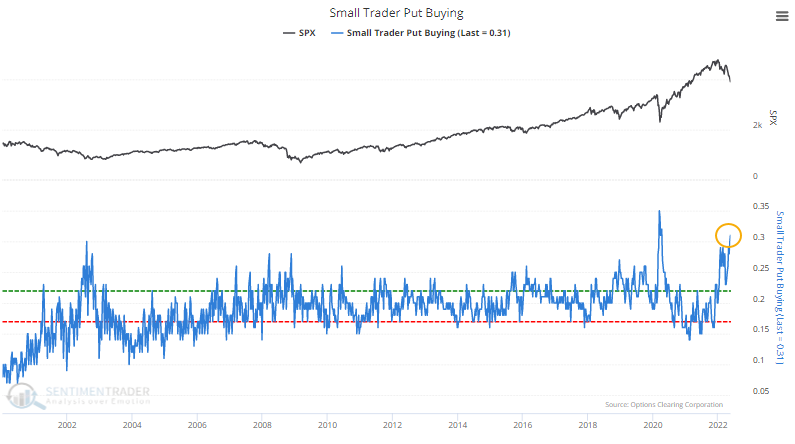
Checking in on the smallest options traders, they continued to increase their leveraged bets against stocks, spending 31% of their volume on buying put options to open. Since the year 2000, only a few weeks in March and April 2020 exceeded this.
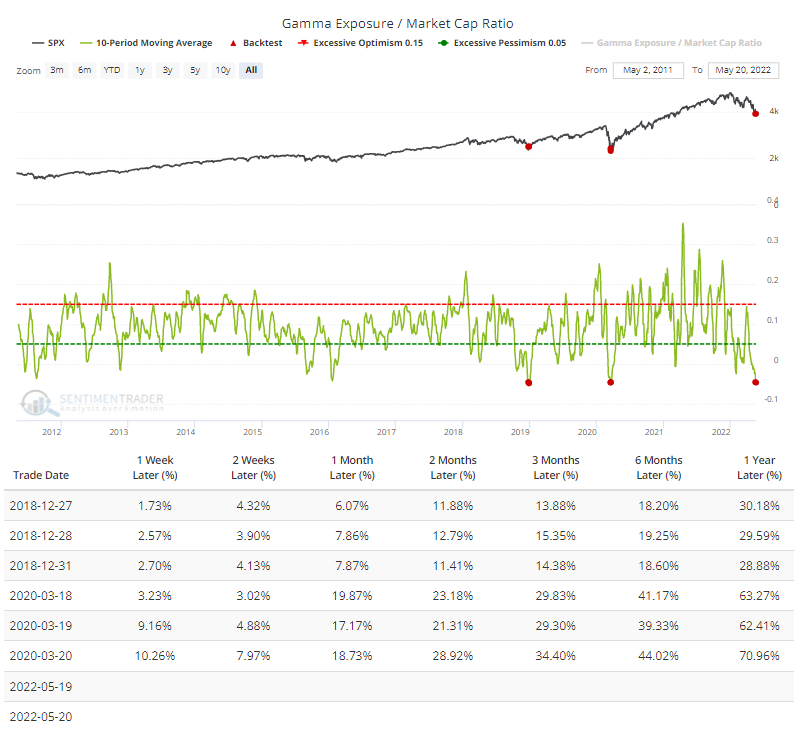
Because of all the put buying, dealers taking the other side have accumulated some of the most skewed Gamma Exposure relative to the market capitalization of stocks. The only other times it averaged about -5% of market cap were at the bottoms in December 2018 and March 2020.
In a purely objective sense, we have not yet seen investors truly capitulate. Several reliable indicators have not thoroughly washed out as they have at several important market bottoms. There is never a turning point when every indicator agrees.
Sure, it's nice when everything agrees and conclusions are tied up with a nice, pretty bow. Those opportunities are rare, and even then, they can fail. From what we have objectively measured so far, sentiment is horrid enough, fear is palpable enough, and selling has been overwhelming enough that even if we're in the midst of a long, drawn-out bear market, pressing short sales here is riskier than buying or holding. At least over a multi-week to multi-month time frame.
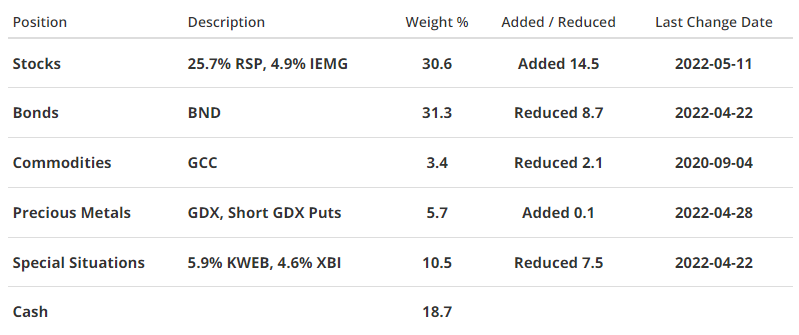
Portfolio updates
STOCKS
S&P 500 Equal-Weight (RSP) - I continue to favor the S&P 500 as an index for equity exposure, as well as the equal-weight version of the index. That is holding up relatively well and hasn't made a lower low during the latest leg down. Now that we're seeing some decent upside interest, this is looking better.
iShares Core MSCI Emerging Markets (IEMG) - No change - I'm okay with holding this for now. There's probably a better opportunity here than in U.S. stocks in the months (years?) to come, especially in some of the more beaten-down sectors as we've covered with Brazil.
BONDS
Vanguard Total Bond (BND) - Finally, some letup in the selling here. The news is starting to turn, with more articles about how big investors are seeing value in fixed income, particularly high-quality corporates. After the historic bout of selling and pessimism, this should prove to be a good sign for BND in the months ahead.
PRECIOUS METALS
VanEck Gold Miners (GDX) - Miners can't seem to get out of their own way. They haven't served as much of a buffer during the last equity rout, which is disturbing. Over the past week, breadth has been so bad that it triggered an extreme reading in a Panic Breadth Composite. When buyers came in after similar signals since 1983, it preceded an excellent risk/reward setup over the next 6-12 months. But when buyers stayed away, it was not pretty. Watching how investors treat these stocks in the coming week(s) should be instructive.
COMMODITIES
WisdomTree Enhanced Commodity Strategy (GCC) - No change here - many commodities have performed splendidly, and we maintain a 2.4% weight, below the target weight of 5%. The issue has been trying to add to positions in this market that have historically done poorly when overbought.
SPECIAL SITUATIONS
KraneShares CSI China Internet (KWEB) - Like the broader market, there are signs of stabilization here after a brutal run. The fund hasn't made a new low in months, but has not yet put in a convincing pattern of higher highs and higher lows. I continue believe this offers a good risk/reward opportunity on a very long-term (1+ year) time frame for the reasons noted in the last update and before.
SPDR S&P Biotech (XBI) - This has not been working. While biotech rebounded modestly from the extremes we noted in February, it failed and fell to persistently lower lows. With attractive valuations, perhaps XBI can find support at its lows from 2018 and 2020, which it kissed a couple of weeks ago. The fund has already exceeded most of the prior precedents' maximum drawdown from the signal dates, suggesting they are less reliable as guides for how investors may behave this time around, so I do not have high conviction in this fund.
Portfolio Summary and Disclaimers
RETURN YTD: -3.9%
2021: +8.7%, 2020: +8.1%, 2019: +12.6%, 2018: +0.6%, 2017: +3.8%, 2016: +17.1%, 2015: +9.2%, 2014: +14.5%, 2013: +2.2%, 2012: +10.8%, 2011: +16.5%, 2010: +15.3%, 2009: +23.9%, 2008: +16.2%, 2007: +7.8%
Not intended as investment advice. In this account, we roughly follow what has become known as the All Weather portfolio popularized by Ray Dalio. It allocates across four broad assets, designed to hold up no matter the market environment. The goal is modest positive returns while limiting large, sustained losses. We typically use popular ETFs with low costs. At times, we will swap out for a fund we believe has better prospects or simply lower fees if not. At other times, we will diverge quite a bit from baseline allocations, largely depending on the indicators and studies we discuss on the site. The base allocation includes stocks (35%), bonds (35%), gold (5%%), commodities (5%) and cash/other (20%).