
PortfolioEdge Update for May 1

Key points:
- Stocks have been range-bound for months, and there are numerous conflicting signals moving forward
- Broader markets have continued to hold up well, which is not typical for ongoing bear markets
- Sectors are seeing more individual performance, unlike the high correlations from last year
Commentary
Last time, I mentioned that sometimes it's just better to sit on one's hands. And here we are a couple of months later, in basically the same spot. Nothing much has changed.
At the time, I noted that a cluster of breadth thrusts had triggered, which has historically been one of the most positive and consistent signals in market history. At the same time, sentiment had become quite stretched to the optimistic side, which has preceded rocky conditions at times, especially during ongoing bear markets.
Whether we're still in one is debatable. As noted last time, the types of underlying strength we've seen since October is NOT something we've ever seen during an ongoing bear market, particularly since 1950.
Recently, our research has focused more on some of the worries being expressed by investors. Divergences in some breadth metrics, lagging cyclical sectors, low volatility, etc., have become popular reasons to reduce exposure. But when we looked in-depth at the record of those conditions, they have not typically been consistently predictive of market declines.
A perfect example is the following one. A chart from a major investment bank went viral because it showed a historically low number of stocks outperforming the S&P 500 index. And indeed, it's true. From our calculations, it's the lowest since 1999 (gasp!). But then we zoomed out.
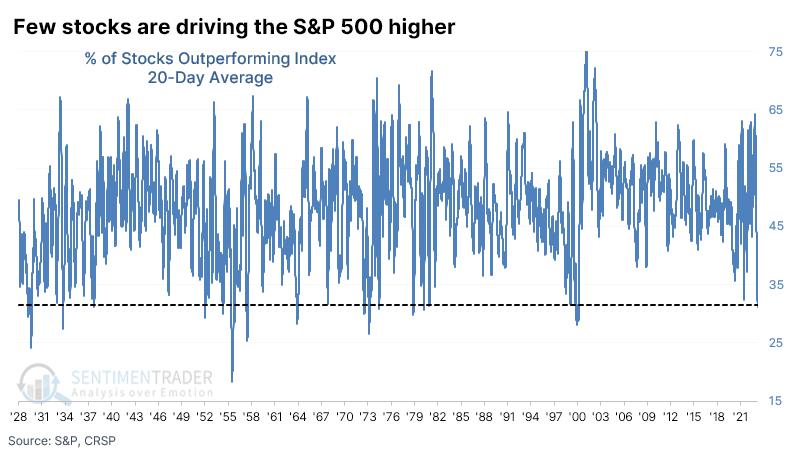
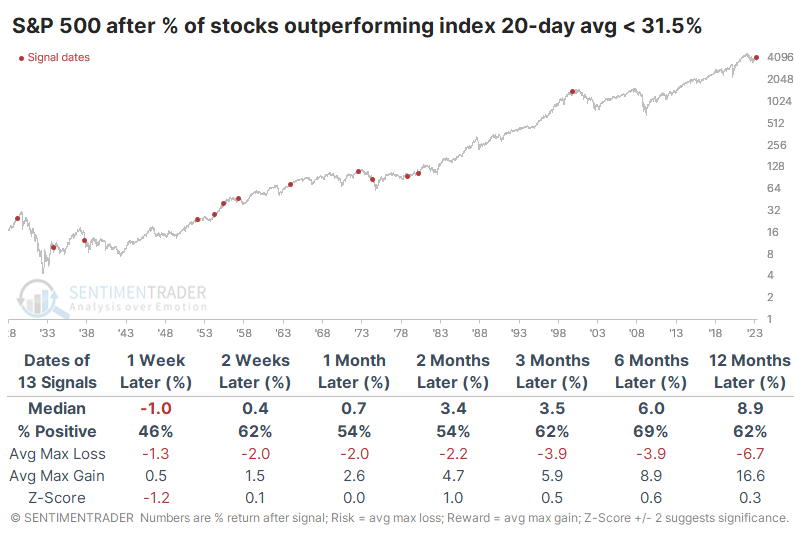
The table below shows every time the 20-day average of outperforming stocks dropped to this low a level for the first time in at least a year. And there were some pretty terrible precedents, most notably in 1999. Even so, there were no double-digit losses over the next year. Stocks were definitely volatile after some of the signals, and several suffered large drawdowns at various points in the next year, but the S&P still showed a median gain of nearly 9%, higher than random. From that study, we also saw that the equal-weight version of the S&P tended to outperform the cap-weighted version.
Mostly, what we've seen from a lot of these concerns is "meh." There just haven't been any terribly consistent studies over a medium- to long-term time frame. Some of them tilted modestly bullish, some modestly bearish, and overall there just has not been a strong bias either way, unlike what we saw from last fall through earlier this year.
To me, that means I want to continue sitting on my hands and seeing how this develops.
It's been much the same in other markets. Bonds have been recovering modestly, and there hasn't been much we've seen to suggest an allocation change either way.
Portfolio updates
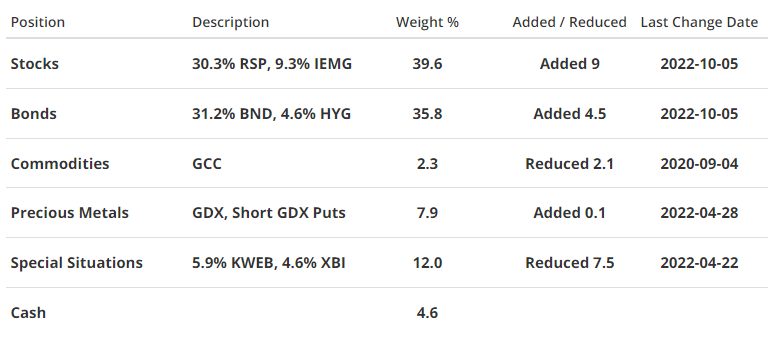
STOCKS
S&P 500 Equal-Weight (RSP) - Thanks to a recent surge in some of the big tech stocks, the cap-weighted version of the S&P has handily outperformed the equal-weight version. That has been a drag on my returns, which is a bit frustrating. But frequently trying to time the changes between the two versions has been more of a drag than not (for me), and I continue to believe that over a long time frame, RSP will do better than funds like SPY. I also see little reason to reduce (or add) exposure at this point. I continue to be extremely compelled by all the studies from months ago showing a high probability of rising prices over a longer time frame, and worried about some shorter-term measures like extreme optimism and some moderate breadth divergences. They mostly seem to cancel each other out, and I'm not compelled to make any major changes.
iShares Core MSCI Emerging Markets (IEMG) - Emerging markets have been just about as range-bound as domestic markets, and much of the optimism that was generated after the big push off the lows has dissipated. We haven't seen much here to be compelled about either way lately.
BONDS
Vanguard Total Bond (BND) - Bond investors must be suffered PTSD after an absolutely disastrous 2022 because sentiment toward the bond market remains historically low. This seems to be true across the spectrum of bonds, from Treasuries to corporates. We haven't seen much in our studies here to suggest a change in allocation.
iShares iBoxx High Yield Corporate Bond (HYG) - I continue to like having a modest amount of exposure here for the yield as well as potential price gains over the longer term.
PRECIOUS METALS
VanEck Gold Miners (GDX) - Last time, I noted that gold miners have historically had trouble holding upside momentum as they showed into February, and that was the case once again. The stocks pulled back hard, then rallied back again even harder. They're once again fairly overbought, and I'm having some trouble deciding what, if anything, to do with this position. So, like everything else, I'm going to sit back and see how it plays out.
COMMODITIES
WisdomTree Enhanced Commodity Strategy (GCC) - I'm not seeing anything especially compelling here, so holding for now.
SPECIAL SITUATIONS
KraneShares CSI China Internet (KWEB) - I mentioned before that the bandwagon-jumping on these stocks had reached a fever pitch. That has typically resulted in at least highly volatile conditions moving forward, and it's fair to say that repeated again this time around. The fund has pulled back persistently, and sentiment is starting to swing back toward the "uninvestable" label slapped on it last summer and fall. Though this is a relatively minor position, its swings have resulted in substantial moves in the overall portfolio, pushing it up close to 7% to start the year and now proving a significant drag. I'll continue to repeat...for all the reasons outlined over the past year, I continue to favor them over a long time frame.
SPDR S&P Biotech (XBI) - Out of all the places I'm allocated, I'm least compelled to hold this one. The case for a rebound in the sector was compelling last summer, and they did recover somewhat. But they can't get out of their own way.
Portfolio Summary and Disclaimers
RETURN YTD: +3.0%
2022: -5.5%, 2021: +8.7%, 2020: +8.1%, 2019: +12.6%, 2018: +0.6%, 2017: +3.8%, 2016: +17.1%
NOT INTENDED AS INVESTMENT ADVICE. This section follows the personal portfolio of a single individual, which may or may not be suitable for anyone else. We do not recommend investments for anyone else, and results are not audited. The service is meant solely for transparency and educational purposes. Weights may not add up to 100% due to rounding and delays in when the site updates multiple funds within positions. In this account, we roughly follow what has become known as the All Weather portfolio popularized by Ray Dalio. It allocates across four broad assets, designed to hold up no matter the market environment. The goal is modest positive returns while limiting large, sustained losses. We typically use popular ETFs with low costs. At times, we will swap out for a fund we believe has better prospects or simply lower fees if not. At other times, we will diverge quite a bit from baseline allocations, largely depending on the indicators and studies we discuss on the site. The base allocation includes stocks (35%), bonds (35%), gold (5%%), commodities (5%) and cash/other (20%).