
PortfolioEdge Update for July 8

Key points:
- Stocks have stabilized, and we continue to see compelling signs of a medium-term rebound
- Longer-term macro and fundamental inputs have deteriorated, clouding that time frame
- Bonds and some sectors have rebounded, while gold and commodities tumble
Commentary
I've been quiet here lately for a reason - I tend to hunker down during bear markets.
The danger with bears is that by trying to get cute and buy "oversold," whatever that means, you get sucked into a panic spiral. But by flipping to net short, you get trampled by vicious rallies.
We're currently stuck - and have been for a while - in a confusing jumble where there are highly compelling suggestions that we should be on the cusp of, or are currently in, a medium-term relief rally. There are other signs, especially of the macro and fundamental variety, that suggest any upside has major headwinds.
Myself, Dean, and Jay have all recently discussed behaviors that suggest a multi-week to multi-month pause in selling pressure is likely. The most compelling ones lately are the historic level of selling pressure and volatility.
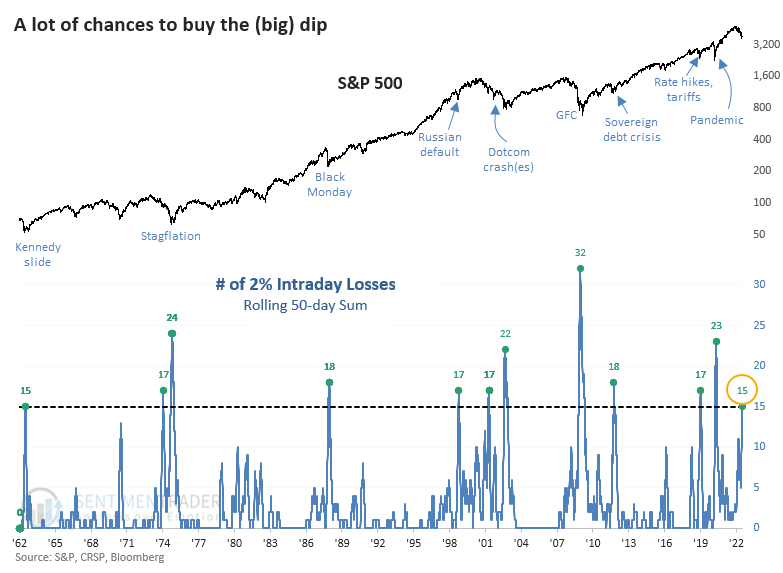
For example, on Tuesday, the S&P 500 suffered another 2% intraday loss, its 15th in the past 50 days. Going back to 1962, a cluster of 15 or more days with a 2% intraday loss is rare; it's happened only a dozen distinct times in 60 years. The clusters read like a who's who of major geopolitical and financial crises. The S&P rallied after each of the others.
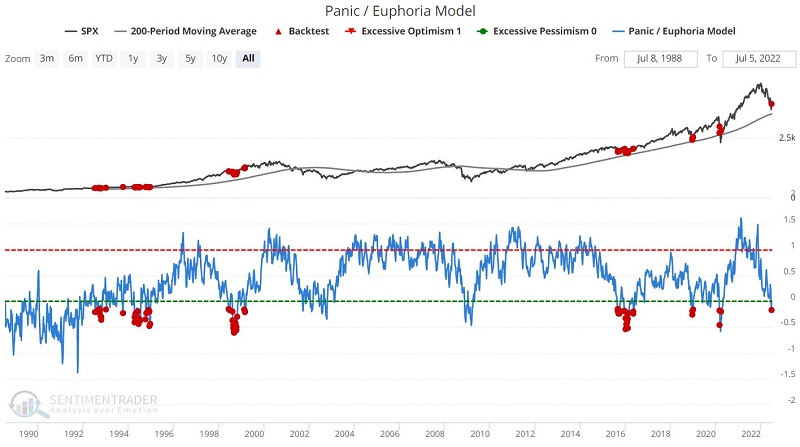
Jay noted that some longer-term sentiment-heavy indicators like the Panic/Euphoria model have moved into Panic territory even while the S&P has held above a (very) long-term trendline.
Dean has noted that while some members of his trend-following and fundamental models have deteriorated, there have been signs of washout selling pressure.
Most of our research over the past 1-2 months, in particular, has noted the likelihood of a pause in selling, and we've arguably seen that. It's just that buyers haven't returned in any overwhelming force, at least not for long. It's disturbing that the buying thrusts we've seen have not enjoyed any follow-through. That's classic bear-market behavior and shows no signs of stopping yet.
The bond market has been a bifurcated mess. While Treasury funds like TLT are holding about where they were two months ago, corporate funds, especially of the high-yield variety, have been depressed. Stocks tend to do much better when high-yield is trending higher, and breadth there is horrific. There haven't been more 52-week highs than 52-week lows among high-yield bonds since January, the longest stretch in at least 15 years.
Gold, and gold miners, have been atrocious. Selling has been so heavy in the latter that it triggered a Panic Breadth extreme at the end of last week, one of the highest readings in 40 years.
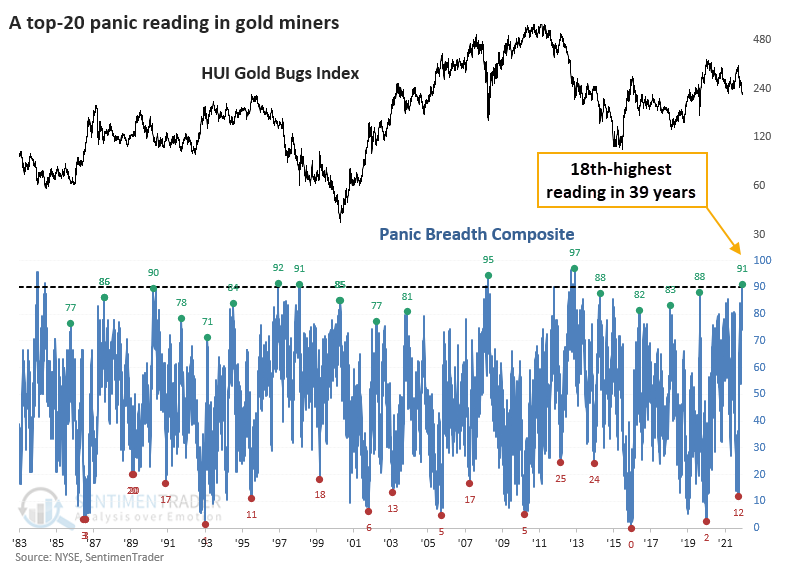
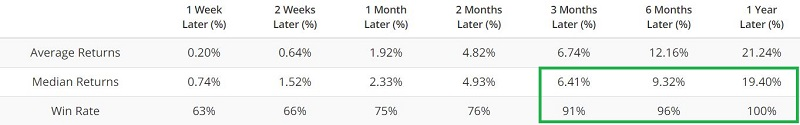
Since our data began in 1983, there have been only five comparable bouts of panic. The good news? Gold miners rallied over the next several weeks every time, showing significant gains. The bad news? Those rallies fizzled out and led to lower lows every time.
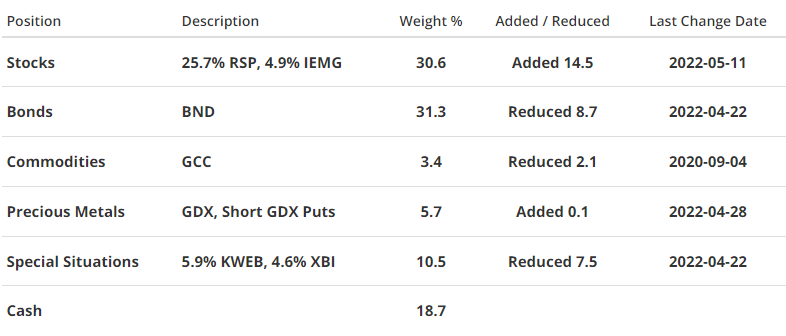
Portfolio updates
STOCKS
S&P 500 Equal-Weight (RSP) - With the destruction in some of the huge-cap stocks, I'm becoming less convinced that an equal-weight version of the S&P 500 is a better vehicle than the much more common capitalization-weighted version. It's the first time in a couple of years that has seemed to be the case, so I may switch funds at some point. I'm fairly positive on the medium-term prospect for stocks (while cautious that gains would be able to hold), so if I do switch funds, it would likely occur with an increase in exposure.
iShares Core MSCI Emerging Markets (IEMG) - This is holding up okay despite a soaring dollar, or at least hasn't yet made lower lows, thanks largely to a continued rebound in Chinese shares. I continue to believe emerging markets may be a better opportunity than domestic ones in the year(s) ahead and am holding for now.
BONDS
Vanguard Total Bond (BND) - There were compelling signs that we'd seen capitulatory selling in early June, and the fund has rebounded thanks to exposure to government bonds. I still don't have a lot of confidence here, given so many failed setups in recent months. Holding for now.
PRECIOUS METALS
VanEck Gold Miners (GDX) - Miners have seen overwhelming selling in recent weeks. That's both a good and bad sign. The sector has a strong tendency to rebound from bouts like this, but also, those rallies have tended to fail. It's not like I have heavy exposure to the group, but I have no interest in adding here and would likely use a multi-week rebound to reduce.
COMMODITIES
WisdomTree Enhanced Commodity Strategy (GCC) - A spike and plunge in commodities, same as it ever was. This is why investors get so frustrated with trying to have exposure to a relatively small market. I'm not seeing anything especially compelling here, so holding for now.
SPECIAL SITUATIONS
KraneShares CSI China Internet (KWEB) - The setup here remains compelling, as we've discussed for months. Investors have re-discovered this group, and mainstream sentiment has been shifting to a much more positive tone. While that's not always a good thing, the setup here is similar to energy in 2020. It's going from an utterly un-investible area to one becoming socially acceptable. I continue to believe this offers a good opportunity on a very long-term (1+ year) time frame. Holding for now.
SPDR S&P Biotech (XBI) - After repeated failed setups, my conviction in this fund dropped significantly in June. There was a last-ditch idea (hope, really) that it might find interest among buyers on a test of the lows from 2018 and 2020. Remarkably, it did and is bouncing nicely. Holding for now.
Portfolio Summary and Disclaimers
 RETURN YTD: -5.6%
2021: +8.7%, 2020: +8.1%, 2019: +12.6%, 2018: +0.6%, 2017: +3.8%, 2016: +17.1%, 2015: +9.2%, 2014: +14.5%, 2013: +2.2%, 2012: +10.8%, 2011: +16.5%, 2010: +15.3%, 2009: +23.9%, 2008: +16.2%, 2007: +7.8%
Not intended as investment advice. In this account, we roughly follow what has become known as the All Weather portfolio popularized by Ray Dalio. It allocates across four broad assets, designed to hold up no matter the market environment. The goal is modest positive returns while limiting large, sustained losses. We typically use popular ETFs with low costs. At times, we will swap out for a fund we believe has better prospects or simply lower fees if not. At other times, we will diverge quite a bit from baseline allocations, largely depending on the indicators and studies we discuss on the site. The base allocation includes stocks (35%), bonds (35%), gold (5%%), commodities (5%) and cash/other (20%).