
PortfolioEdge Update for Jul 7

Key points:
- The S&P 500 has followed through on bullish studies and trend-following measures are turning higher
- Sentiment has become excessively optimistic, but that's less reliable during new bull markets
- Bonds, gold, and commodities have performed mostly poorly but aren't giving compelling buy signals
Commentary
Last time (and the time before that), I mentioned that sometimes it's just better to sit on one's hands. I can't recall a time I've been less active than the past six months because the most important market has been unnaturally calm, and doing what it should.
My goal with this portfolio has always been to minimize losses when markets are bad and try to hold on when markets are good. I try to keep losses to a minimum and let gains take care of themselves. It worked pretty well last year, and by January the account was sitting at a new high, thanks to the surge in Chinese tech stocks. That has since evaporated, and I've been twisting in the wind for months.
We're in kind of a pickle right now because there are two very compelling forces in direct opposition. Most importantly, the most benchmarked index in the world (the S&P 500) has properly followed through on all the positive studies, with more and more trend-following indicators confirming the likelihood of a new bear market. The secondary factor, in direct opposition, is that sentiment has now become excessively optimistic, which has consistently preceded weak annualized returns.
Since last October, we've spent a lot of time outlining the various breadth thrusts in sectors, industries, and across broad indexes. The lasting push has finally been enough to trigger a new all-time high in the S&P 500's Cumulative Advance/Decline Line.
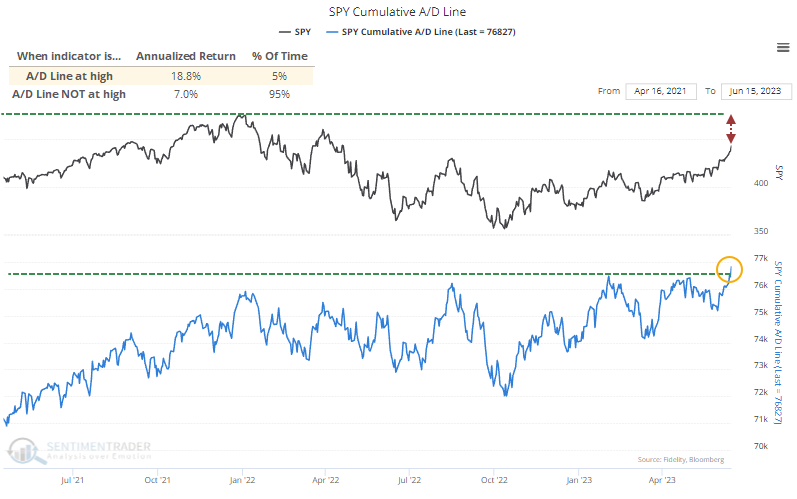
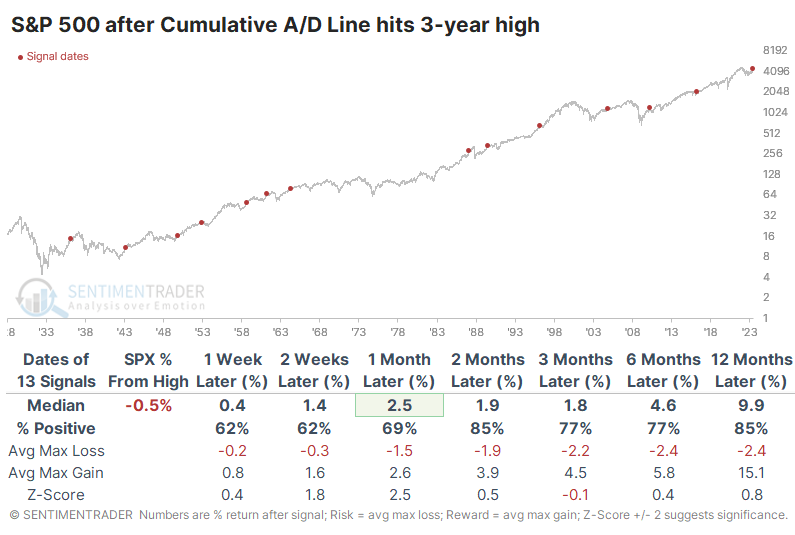
Not only did the A/D Line reach a fresh 52-week high, but it's also a multi-year high. The only signal that suffered a more than -10% drawdown within the next six months was in 2010, which quickly reversed as the S&P soared to new highs.
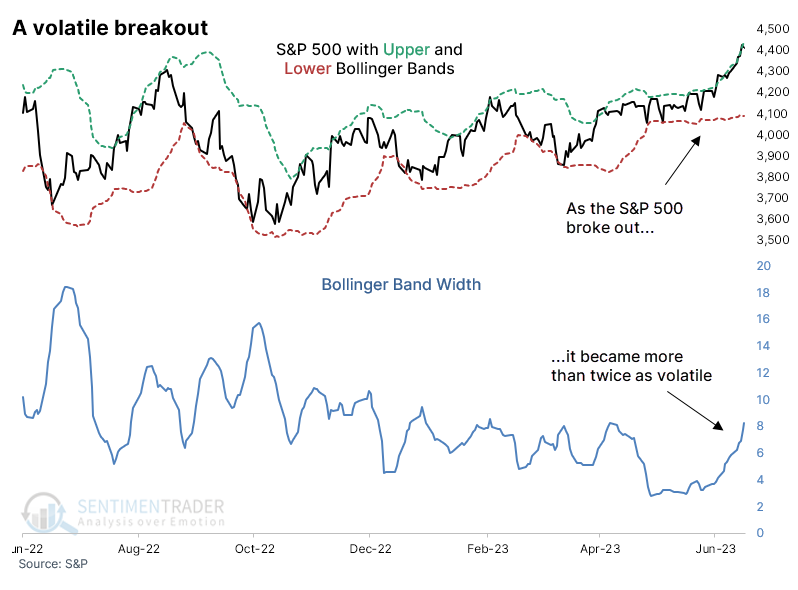
The S&P itself also broke out to a new 52-week high recently, with volatility expanding. This is unusual, as we are more likely to see the distance between upper and lower Bands widen as stocks decline and get more volatile.
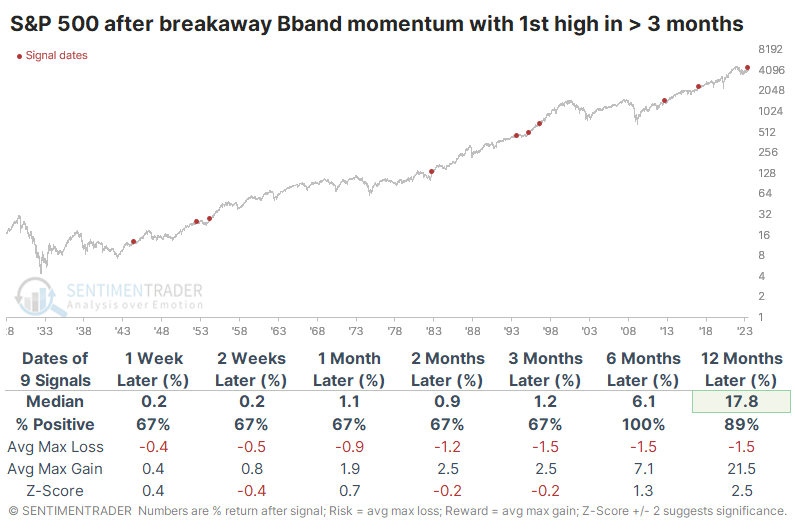
The table below shows S&P returns after the same types of momentum using Bollinger Bands, but with the added condition that it's the first set of 52-week highs in the index in at least three months. This prevents us from comparing the recent breakout to something like 1929 or 2000, when stocks had been hitting new highs for months. The risk/reward for the index going forward was exceptionally positive.
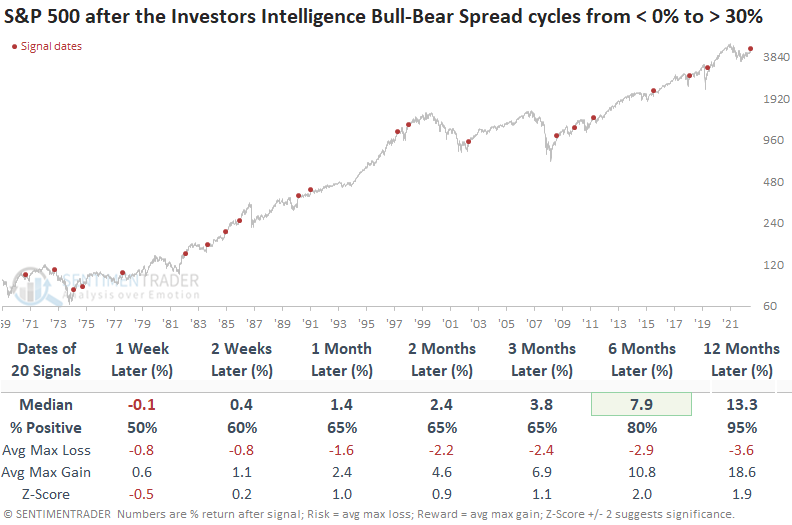
The reversal from pessimism to optimism in sentiment indicators continued as investors embrace the bullish price action in stocks. The oldest stock market survey, Investors Intelligence, which measures newsletter writers, showed an increase in bulls relative to bears. The spread between survey members who are either bullish or bearish has now cycled from less than 0% to greater than 30% for only the 21st time since 1971.
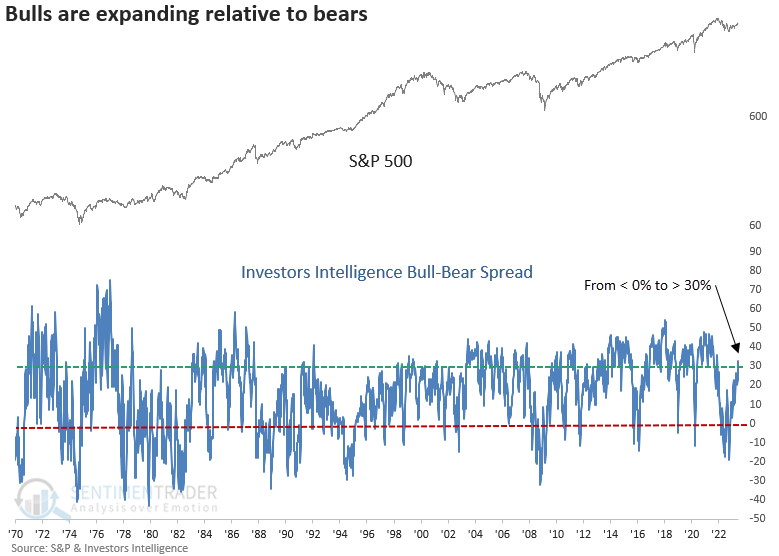
After similar reversals, Dean noted that the S&P 500 struggled during the first few weeks but the index was higher a year later in all but one case. New bull markets require investors to become more bullish.
Despite what has been a runaway market, Wall Street strategists haven't been upgrading their year-end price targets much at all for the S&P 500. As a result, the index is more than 8% higher than what strategists, on average, guessed it would be six months from now. That's the 2nd-largest overshoot in 24 years.
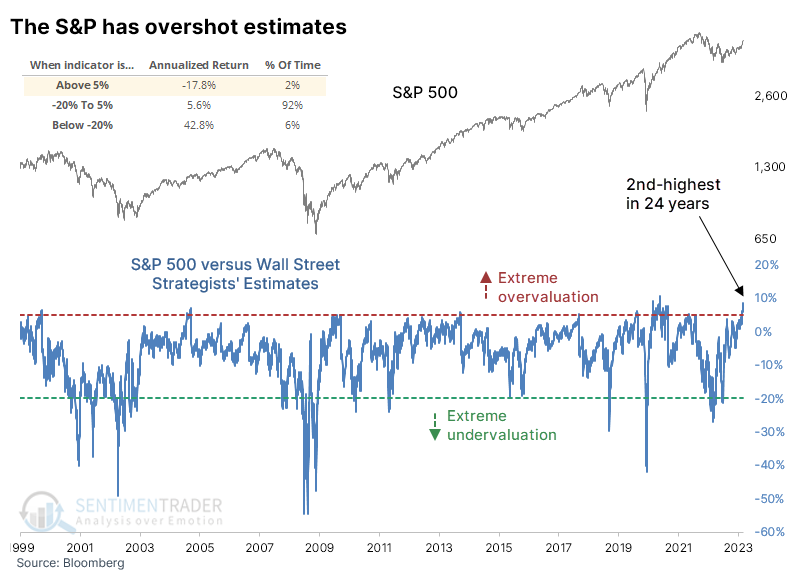
The S&P has tended to show poor annualized returns after the small number of days when it gets so far ahead of the strategists.
Also, the spread between Smart and Dumb Money Confidence reached rarified air last week before reversing a bit with a few minor down days. When the spread reached the type of level it recently hit, the S&P's annualized return was poor.
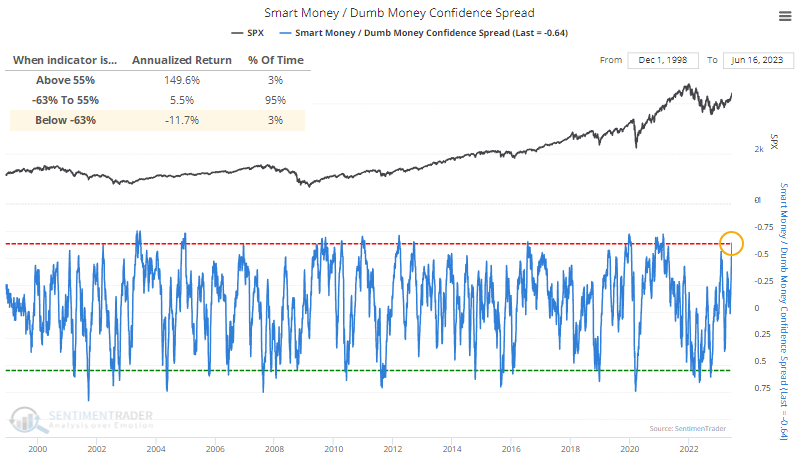
But here's the thing about sentiment - it doesn't tend to get this stretched during ongoing bear markets. When the spread reverses from such a wide extreme, it occurred only once during a protracted bear, in 2002. All the others were triggered during bull cycles when investors are more willing to take risks and keep doing so.
So that's what has me tied up in knots at the moment. Sentiment is stretched, and that is a consistent warning sign. It's an outright sell signal during bear markets, but the evidence has been stacking up that we're no longer in that type of environment. Therefore, I'm not willing to reduce exposure based simply on stretched sentiment, and will require some type of change in behavior in the coming weeks+ to reduce the probability that we have changed market environments from the 2022 disaster.
Portfolio updates
STOCKS
S&P 500 Equal-Weight (RSP) - Thanks to surges in a handful of gigantic stocks, the cap-weighted version of the S&P 500 has handily beaten the equal-weight version. We recently looked at the divergence between the two versions of the index, and it showed a historic spread between the 3-month rate of change in the two indexes. After similar behavior, the equal-weight version of the index outperformed the cap-weight version by an average of more than +13% over the next year.
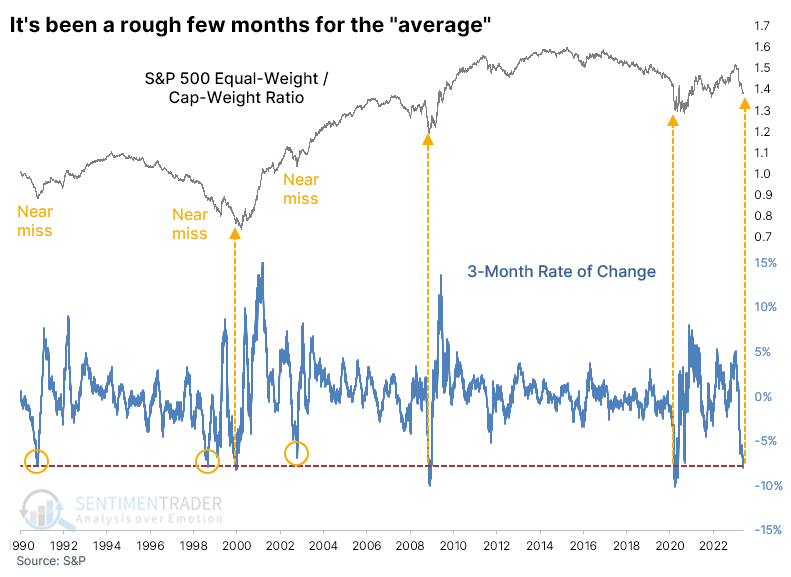
Based primarily on this study, I have no interest in switching to the cap-weight version of the index. I'm also not too eager to reduce (or add) exposure, based on the discussion above. The likelihood that we're in a new bull market environment is high, so the current bout of excessive optimism does not have a great track record at highlighting successful sell signals.
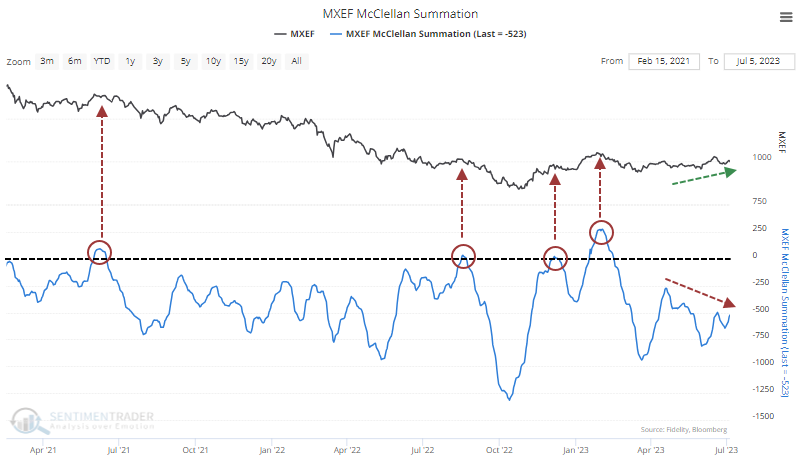
iShares Core MSCI Emerging Markets (IEMG) - Emerging markets have been holding up fairly well, but momentum is lacking. The McClellan Summation Index, a reflection of long-term internal momentum among emerging market stocks, has been stuck below the zero line and is even showing a negative divergence. This continues the exceptionall weak pattern since 2001, with every poke into positive territory leading to at least a short-term peak. I'd like to see this change before adding any exposure to this area.
BONDS
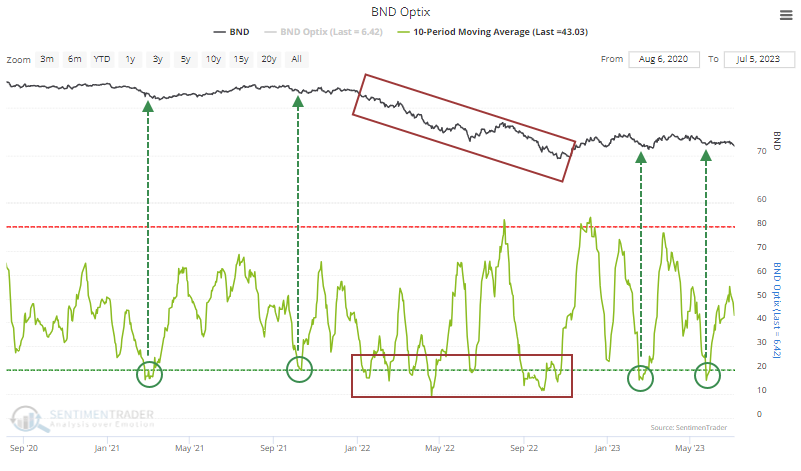
Vanguard Total Bond (BND) - Bonds cannot rally well, with the 10-day Optimism Index recently cycling into an oversold condition but BND not holding its gains. This is troublesome because it's similar to what happened during much of 2022. Outside of that bear market, oversold signals had a much better track record. This is not encouraging.
iShares iBoxx High Yield Corporate Bond (HYG) - While they haven't been rallying as steadily as stocks, and are getting hit pretty hard today, Dean just showed that within the high-yield bond market the spread between 52-week highs and lows as a percentage of issues traded crossed the 8% mark for the first time since September 2021. It got nowhere this level during 2021-22.
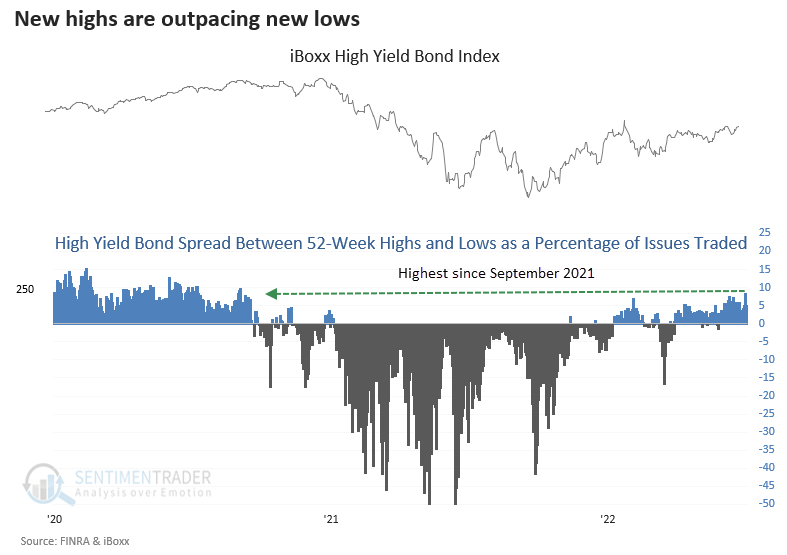
When the spread between highs and lows as a percentage of issues exceeds 8%, the iBoxx high yield index has risen in the months ahead every time. Granted, the study period only includes a few bear markets, but this kind of internal surge was never seen during the midst of any of the bears. Only bull markets have witnessed this type of behavior.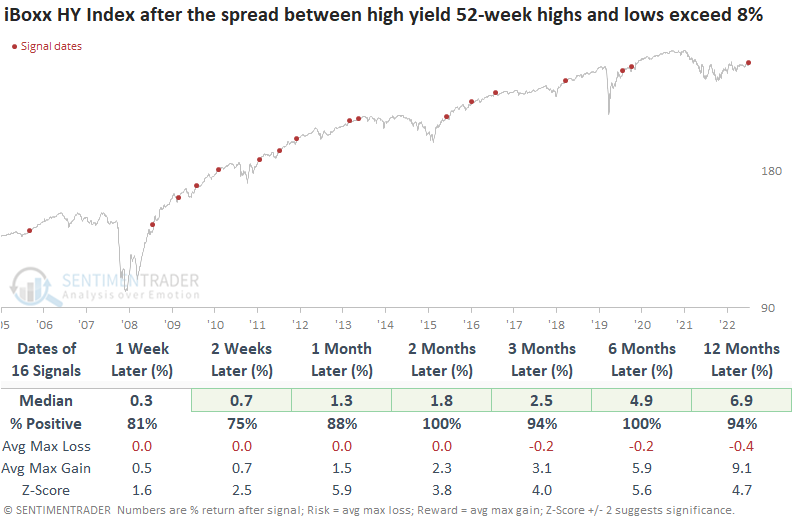
There are a lot of scary headlines about potential trouble looming among weak companies with big debt loads and rising interest rates, but with so many high-yield bonds hitting new highs relative to those falling to new lows, it's hard to give those headlines much credence.
PRECIOUS METALS
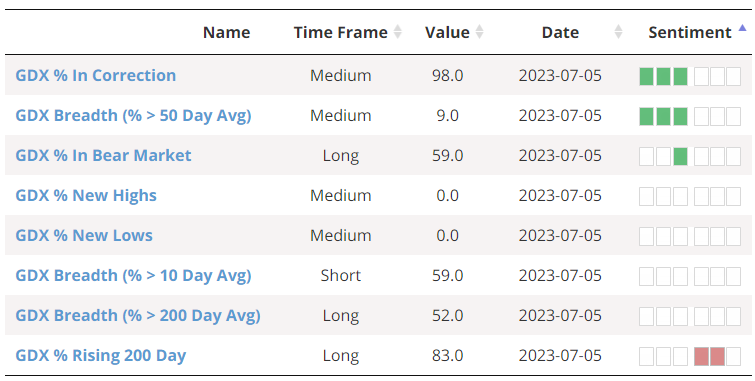
VanEck Gold Miners (GDX) - Last time, I noted that gold miners were once again fairly overbought, and historically they have had a lot of trouble maintaining gains after that kind of condition. They did once again, with very poor performance since that signal. Even so, they're not yet oversold. Among some of the custom breadth indicators complied by SentimenTrader, only a couple are deep into excessive territory.
COMMODITIES
WisdomTree Enhanced Commodity Strategy (GCC) - Commodities overall haven't done much of anything all year. Within the group, grains enjoyed a spectacular rise for a couple of weeks based on drought conditions, but historically it has had great difficulty holding gains after similar surges.
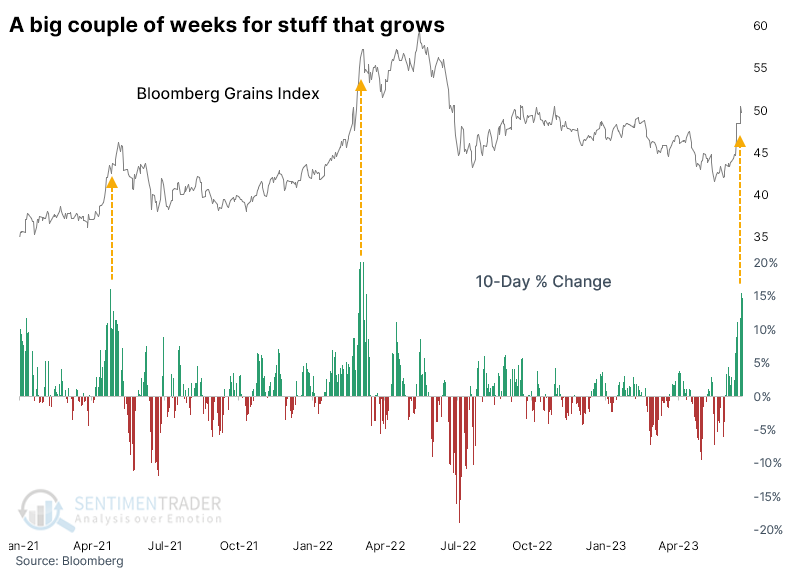
Since the 1970s, the grains index averaged a return of -8.6% in the six months after similar 10-day jumps, which would naturally also be a drag on broader commodity funds like GCC should the historical pattern repeat.
SPECIAL SITUATIONS
KraneShares CSI China Internet (KWEB) - What a frustrating investment this has been this year. Even ignoring hyperbolic headlines from U.S.-based media, the stocks have failed to follow through on potential basing action. I mentioned before that this is meant as a very long-term (multi-year) position, because volatility is exceptionally high, and the reasons I entered were very long-term in nature. So I try to mostly ignore the shorter-term noise. Still, the fund has had a big impact on returns this year, including a major drag over the past couple of months. I'll continue to repeat...for all the reasons outlined over the past year, I continue to favor them over a long time frame.
SPDR S&P Biotech (XBI) - This has been another disappointment. While biotechs have done quite well since March, they have underperformed their historical returns after washouts similar to last spring. XBI has gone essentially nowhere for the past year. I'm willing to give it room, but as noted previously, I am less committed to this than anything.
Portfolio Summary and Disclaimers
The weights in the table below are not fully accurate. The way our system is set up, the weight won't change for multiple positions (e.g. Stocks) unless one of the components in the description changes.
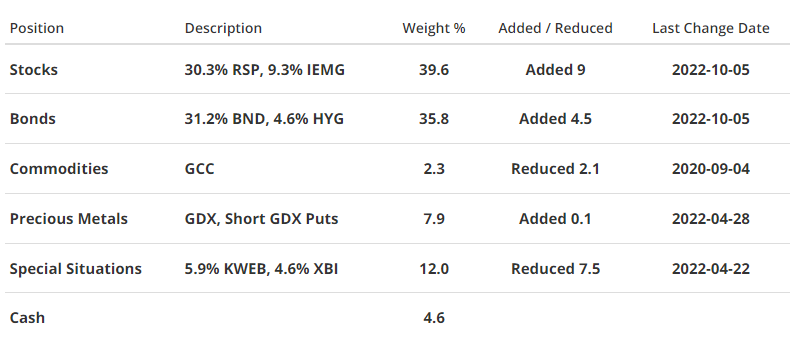
RETURN YTD: +2.5%
2022: -5.5%, 2021: +8.7%, 2020: +8.1%, 2019: +12.6%, 2018: +0.6%, 2017: +3.8%, 2016: +17.1%
NOT INTENDED AS INVESTMENT ADVICE. This section follows the personal portfolio of a single individual, which may or may not be suitable for anyone else. We do not recommend investments for anyone else, and results are not audited. The service is meant solely for transparency and educational purposes. Weights may not add up to 100% due to rounding and delays in when the site updates multiple funds within positions. In this account, we roughly follow what has become known as the All Weather portfolio popularized by Ray Dalio. It allocates across four broad assets, designed to hold up no matter the market environment. The goal is modest positive returns while limiting large, sustained losses. We typically use popular ETFs with low costs. At times, we will swap out for a fund we believe has better prospects or simply lower fees if not. At other times, we will diverge quite a bit from baseline allocations, largely depending on the indicators and studies we discuss on the site. The base allocation includes stocks (35%), bonds (35%), gold (5%%), commodities (5%) and cash/other (20%).