
PortfolioEdge Update for Feb 10

Key points:
- The recovery in stocks has continued to a historic degree
- Thrusts like this across indexes, sectors, exchanges, assets, and countries are typically seen at the beginnings of new bull markets
- Bonds have recovered as well but with much less investor optimism, while gold may struggle after a recent surge
Commentary
Sometimes, it's just better to sit on one's hands. This is precisely what I've been doing for a few months, and have been comfortable doing so. The trouble is, whenever investing feels comfortable, it can quickly morph into complacency.
That attitude is especially dangerous during bear markets. And that's the great argument right now, whether we're still actually mired in a bear market. In December, we looked at several factors arguing that we weren't. The case has only gotten stronger since then.
After plunging to one of the worst levels in 30 years, the market's internal momentum has completely reversed. For the first time in two years, the NYSE version of the Summation Index has crossed above +1,000 after declining below -1,000 last fall.
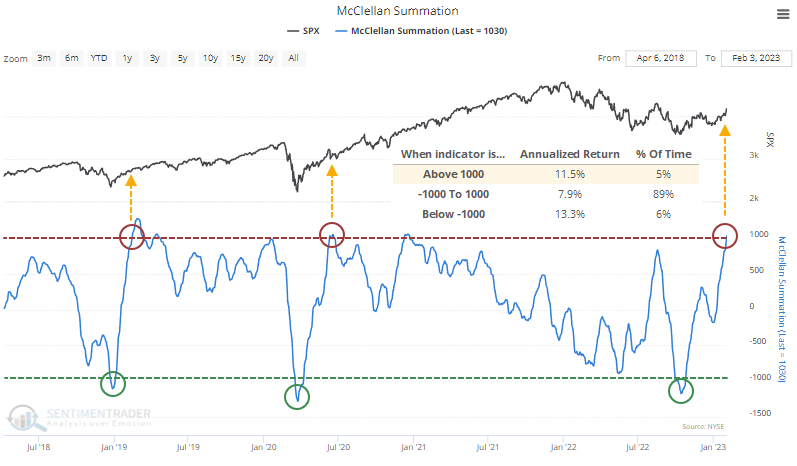
As we outlined with several other studies, like renewed long-term uptrends among sectors and industries, these readings are not seen during ongoing bear markets. It did not happen during the last two bears or any before them.
The S&P 500's returns following cycles in the Summation Index from below -1,000 to above +1,000 were pristine. There was a single tiny loss three or six months later, but all showed a positive return over the following year.
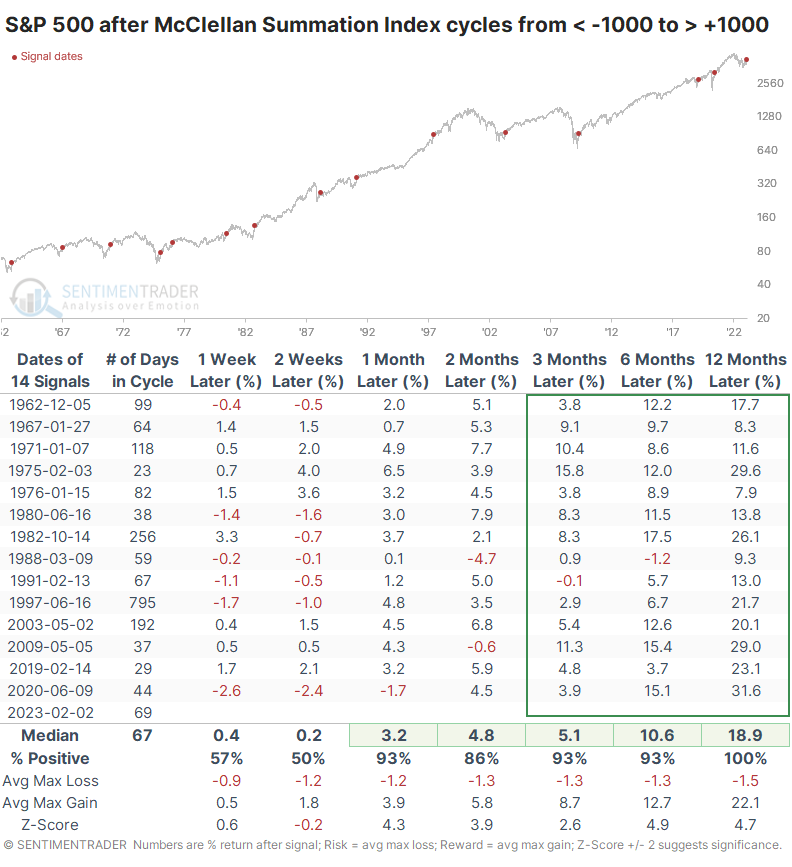
The most significant drawdown among any signal within the next year was a modest -6.8%. At the same time, every signal saw a rally of at least +11.4%.
It's not just securities on the NYSE that have recovered. The Nasdaq McClellan Summation Index has similarly cycled from an extreme low to extreme high. Even more notably, we can see the same behavior in the Summation Indexes in the French CAC, German DAX, UK FTSE, and Hong Kong's Hang Seng.
The biggest worry among contrarians right now is a high level of optimism across indicators. There are some exceptions (there always are), but there is little denying that, overall, investors have turned quite optimistic.
Early last October, Dumb Money (mostly trend-followers) was selling ferociously, while Smart Money (mostly corporate insiders and institutional traders) was buying. Since then, a persistent and remarkably broad-based rally in financial assets has dramatically shifted sentiment. The Spread between Dumb Money and Smart Money confidence in a further rally has fully cycled from one extreme to the other.
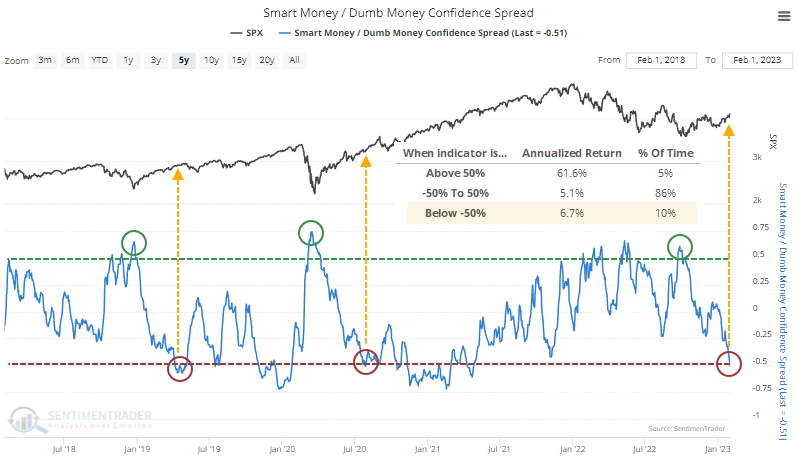
Sentiment works differently in bull and bear markets. We can see in the chart above that the S&P's annualized return is better at the extremes than it is when sentiment is in the mushy middle. Since we began computing this in 1998, whenever the Spread was below -0.5, the S&P 500 was positive over the next year 93% of the time, averaging 12.3%.
Perhaps the best way to look at this is by comparing it to other sentiment cycles. These are times when the Spread cycled from above +0.5 to below -0.5, from deep pessimism to high optimism. Over the next six months, the S&P showed a positive return after 9 of the 12 cycles. What seems notable is that the three outright failures all failed immediately. While a negative return over the next 1-2 weeks did not guarantee a negative long-term return, a negative long-term return was precipitated by a negative short-term return each time. The reaction so far has not been good, so that is a modest concern.
We have spent a lot of time on the research side looking at other technical recoveries. The evidence is overwhelming, and it is broad. Even going back to the 1930s, it has been exceptionally rare - if not downright unprecedented - to see readings like we have recently during any kind of protracted bear market.
Portfolio updates
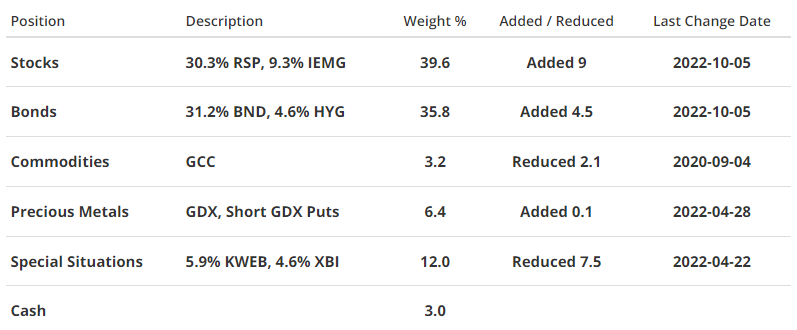
STOCKS
S&P 500 Equal-Weight (RSP) - I see little reason to adjust exposure here. The signs of recovery we've witnessed over the past few months have a high probability of only occurring after the end of the worst of the selling pressure during bear markets. Small-cap stocks have a tendency to show higher average returns following these signals, so I continue to favor the equal-weight version of the S&P 500 index over the traditional cap-weighted version.
iShares Core MSCI Emerging Markets (IEMG) - My reasoning for having a positive outlook on emerging markets has not changed much, even after a 25%+ rally off the lows. We have seen similar recoveries within these markets as we have for domestic ones, and those tend to precede even higher prices over the next 6-12 months. Signals tend to be less consistent in these markets, but they still point to a compelling medium- to long-term bullish view.
BONDS
Vanguard Total Bond (BND) - After a record bad year in 2022, bonds have stormed out of the gate. The argument for adding exposure here is significantly less compelling than it was last October, so for now I'm okay with just letting it ride. I've seen few signs so far that the rally has generated the kinds of sentiment extremes that would cause me to reduce exposure. In fact, our Bond Optimism Index just fell to another very low reading despite a relatively modest pullback in prices.
iShares iBoxx High Yield Corporate Bond (HYG) - Junk continues to be a beneficiary of improved risk-on sentiment. I continue to like having a modest amount of exposure here, for the yield as well as potential price gains over the longer-term.
PRECIOUS METALS
VanEck Gold Miners (GDX) - Gold miners staged a ferocious rally over the past few months, and recently hit overbought extremes. In our research, we found that the sector has had great difficulty holding upside momentum like it recently generated, so it wouldn't be surprising to see further choppiness at best.
COMMODITIES
WisdomTree Enhanced Commodity Strategy (GCC) - I'm not seeing anything especially compelling here, so holding for now.
SPECIAL SITUATIONS
KraneShares CSI China Internet (KWEB) - After suffering some of the worst losses of any sector in any market ever heading into the fall of 2022, investors have rediscovered the opportunity here. Unfortunately, the bandwagon-jumping reached a near-fever pitch a few weeks ago, and the shares have understandably taken a breather. If history is any guide whatsoever, then these stocks will likely see high volatility, but for all the reasons outlined over the past year, I continue to favor them over a long time frame.
SPDR S&P Biotech (XBI) - This fund broke out of a modest consolidation pattern last month and made a little run before pulling back again. While not nearly as compelling as some other sector bets like Chinese tech, the long-term outlook appears positive due to a reversion from some of the historic pessimism we outlined last year. I'm willing to let it ride.
Portfolio Summary and Disclaimers
 RETURN YTD: +4.5%
2022: -5.5%, 2021: +8.7%, 2020: +8.1%, 2019: +12.6%, 2018: +0.6%, 2017: +3.8%, 2016: +17.1%, 2015: +9.2%, 2014: +14.5%, 2013: +2.2%, 2012: +10.8%, 2011: +16.5%, 2010: +15.3%, 2009: +23.9%, 2008: +16.2%, 2007: +7.8%
Not intended as investment advice. In this account, we roughly follow what has become known as the All Weather portfolio popularized by Ray Dalio. It allocates across four broad assets, designed to hold up no matter the market environment. The goal is modest positive returns while limiting large, sustained losses. We typically use popular ETFs with low costs. At times, we will swap out for a fund we believe has better prospects or simply lower fees if not. At other times, we will diverge quite a bit from baseline allocations, largely depending on the indicators and studies we discuss on the site. The base allocation includes stocks (35%), bonds (35%), gold (5%%), commodities (5%) and cash/other (20%).