
PortfolioEdge Update for Dec 9

Key points:
- Stocks enjoyed impressive and broad-based thrusts in recent weeks
- There are compelling signs that this is a change in character from prior rallies
- Bonds, Chinese tech, and other markets have seen similar sharp rebounds
Commentary
During protracted bear markets, two strategies tend to perform the best, at least among those who are typically long-only investors:
- Employ an active trend-following methodology
- Do nothing
The success of both depends on time frame. For those with a short- to medium-term one, option #1 tends to be the best solution. For others, #2 is often the best. It requires sitting through uncomfortable drawdowns, but also lessens the risk of missing out on the best days that tend to come during volatile periods.
During the 2008 bear market, I was firmly in camp #1. Not necessarily just trend-following, but I was actively trading S&P 500 futures. It worked well, and I was miserable.
During the current bear, I've probably erred too far in the other direction. Despite what could have, and should have, been some fairly reliable buy-then-sell trades, I've mostly been inactive. After putting more cash to work during the depths of pessimism in October, I haven't done much. I still think that's the right path moving forward.
The reason is that after conditions like the past two months, with excessive pessimism followed by impressive and broad-based thrusts, stocks have an extremely strong record of adding to gains. That could have (and was by me) argued in August, and it failed. There are compelling reasons to believe this time is different than then.
The S&P 500 index has diverged with many of its stocks, as underlying participation has been better than the index's performance. That led to more than 90% of members rising above their medium-term trendlines.
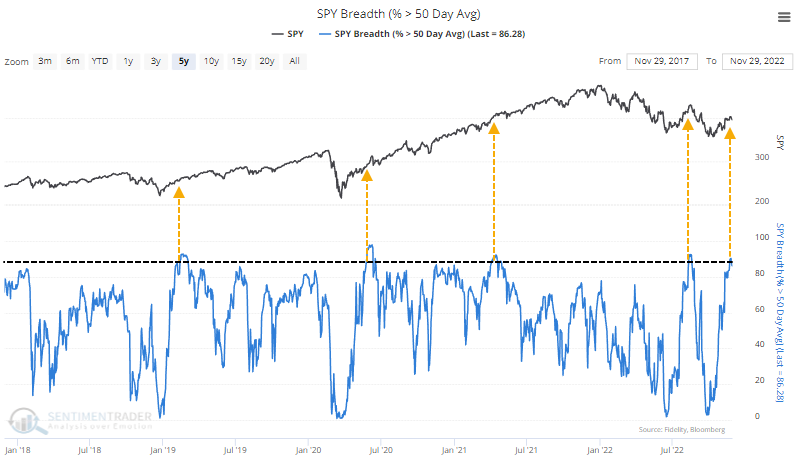
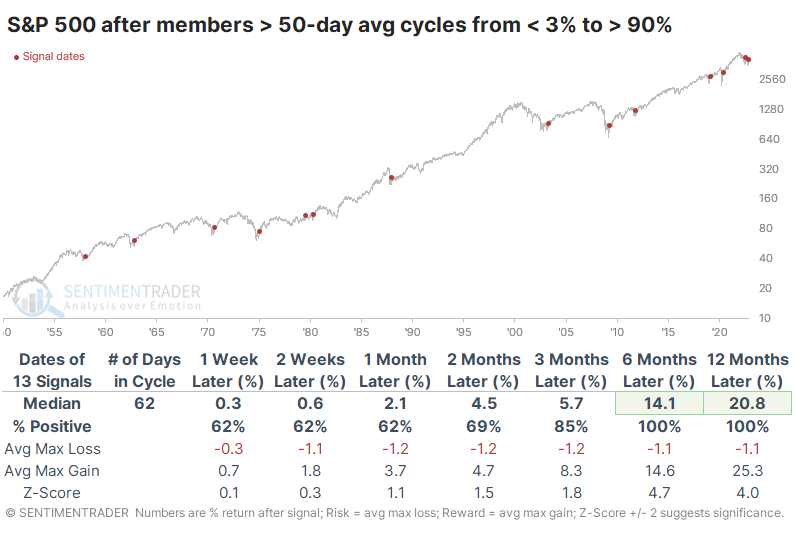
During modern markets, there have been 13 other times when the percentage of S&P 500 members above their averages cycled from fewer than 3% to more than 90%. All of them showed gains 6-12 months later.
The biggest caveat here is that the last signal was a miserable failure, the worst one in 70 years. It's the only time the S&P lost more than 10% at any point within a year.
But we're seeing much stronger participation than August in several sectors, and across broader universes like the NYSE as a whole. Dean showed that more than half of securities on the NYSE are now in long-term uptrends.
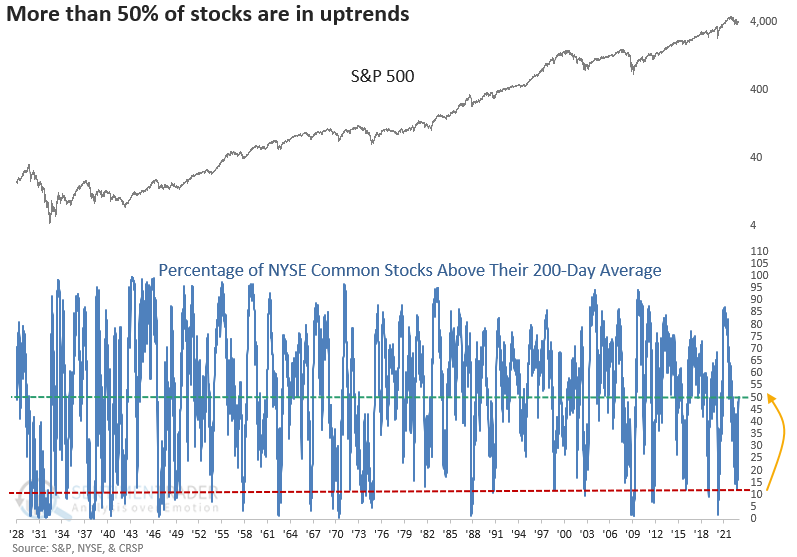
When the percentage of NYSE common stocks above their 200-day average cycles from < 13% to > 50%, returns, win rates, and z-scores were excellent across all time frames. When the indicator also hit at least an 8-month high (which it did this time), the S&P never showed a negative 6-12 month return since 1942.
There has even been a strong recovery in long-term uptrends around the world.
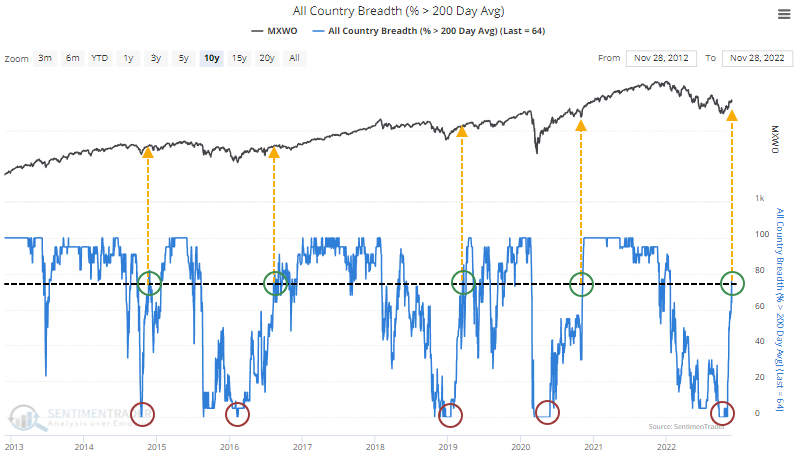
After similar recoveries, the MSCI World Index tended to suffer short-term profit-taking, but they were good signs of long-term momentum. While the average return and win rates weren't exceptional, risk was low. And it tended to be very good for the S&P 500, as well.
There are certainly concerns that remain, mostly in the fundamental and economic realm. But the combination of extreme pessimism followed by some of the best buying thrusts in years, amid a consistently positive seasonal window, suggests further upside.
Portfolio updates
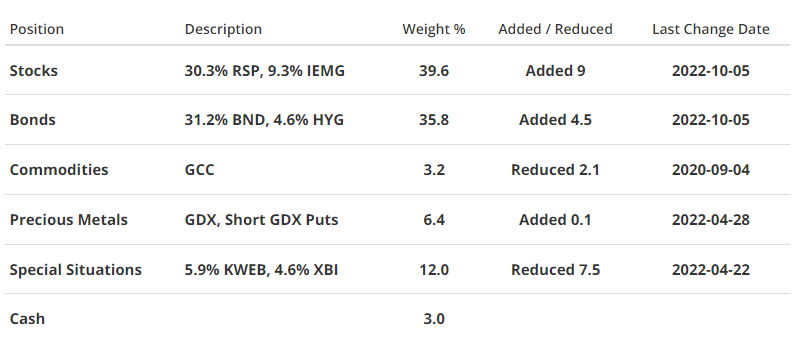
STOCKS
S&P 500 Equal-Weight (RSP) - As I noted in the prior update, I was more willing to add exposure if stocks fell and generated more extremes than I was to lighten exposure. I did that in October and am willing to sit tight for a while to see if this latest thrust is truly different than the ones earlier in the year. Signs are compelling that it is. I continue to favor the equal-weight version of the S&P 500 index over the traditional cap-weighted version.
iShares Core MSCI Emerging Markets (IEMG) - Same goes for emerging markets. I had relatively high confidence the dollar's strong uptrend was peaking for all the reasons we've discussed on the site. Currency trends tend to be quite sticky, but the recent plunge in the buck has tended to lead to even more downside, which should greatly help a recovery in emerging market stocks for U.S. investors.
BONDS
Vanguard Total Bond (BND) - Bonds across the spectrum have enjoyed massive rebounds (relative to the asset's typical volatility). That has alleviated the historic pessimism that built up from June through October. We're really in a never-seen-before situation here with some of these price moves. Typically, rebounds like we've seen in BND and other funds from one-year lows have reliably occurred at major inflection points, so this should be a continued bullish factor. The trouble is it happened in July/August, as well, and that failed. I continue to have low confidence in this market.
iShares iBoxx High Yield Corporate Bond (HYG) - Junk has been a decent beneficiary of the combination of improved sentiment toward the stock market, as well as a general bond market recovery. I continue to like having a modest amount of exposure here, for the yield as well as potential price gains over the longer-term.
PRECIOUS METALS
VanEck Gold Miners (GDX) - Miners have enjoyed their best rally of the year over the past month. More than 60% of them recently climbed above their 200-day moving averages, which is a level that has preceded trouble spots for the group since the 2020 peak. This is a sector that continually gives long-term investors heartburn, so we'll have to see if this is one of those rare times they can build on a positive trend.
COMMODITIES
WisdomTree Enhanced Commodity Strategy (GCC) - I'm not seeing anything especially compelling here, so holding for now.
SPECIAL SITUATIONS
KraneShares CSI China Internet (KWEB) - Finally, some relief for tech investors in the Asian giants. The fund has rebounded strongly in recent weeks, and as we showed in a recent report, the stocks underlying this fund have done even better. There are compelling signs that the latest rally is different, more intense, than the one in the summer. History here is limited, but the few other times the sector performed like this, it preceded consistent and impressive 1- to 2-year gains.
SPDR S&P Biotech (XBI) - Biotech stocks have spent weeks consolidating their gains from October and November, when they held up well despite broader market weakness. This is a marked change from most of the past year, and I'm willing to let them ride and see if it finally morphs into longer-term outperformance.
Portfolio Summary and Disclaimers
 RETURN YTD: -3.7%
2021: +8.7%, 2020: +8.1%, 2019: +12.6%, 2018: +0.6%, 2017: +3.8%, 2016: +17.1%, 2015: +9.2%, 2014: +14.5%, 2013: +2.2%, 2012: +10.8%, 2011: +16.5%, 2010: +15.3%, 2009: +23.9%, 2008: +16.2%, 2007: +7.8%
Not intended as investment advice. In this account, we roughly follow what has become known as the All Weather portfolio popularized by Ray Dalio. It allocates across four broad assets, designed to hold up no matter the market environment. The goal is modest positive returns while limiting large, sustained losses. We typically use popular ETFs with low costs. At times, we will swap out for a fund we believe has better prospects or simply lower fees if not. At other times, we will diverge quite a bit from baseline allocations, largely depending on the indicators and studies we discuss on the site. The base allocation includes stocks (35%), bonds (35%), gold (5%%), commodities (5%) and cash/other (20%).