
Playing t-bond seasonality in the face of rate cut conventional wisdom

Key Points
- Treasury bonds failed to mount much of a rally during their most favorable seasonal period of the year
- They now enter a period of typical weakness - but with a potential Fed rate cut in the offing
- TLT options offer a limited risk to play the bearish fall tendency
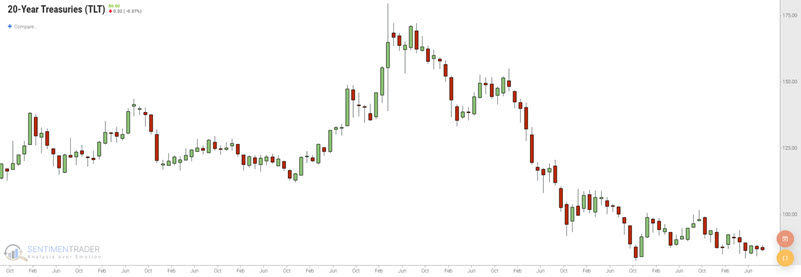
TLT has been a dreadful performer for years
The chart below shows the dreadful performance for the iShares 20+ Year Treasury Bond ETF (TLT) in recent years as interest rates have risen steadily from less than 1% to almost 5%.
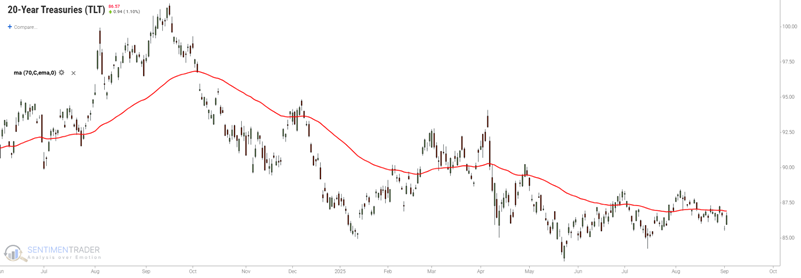
The "popular" interpretation now seems to be that a) a long base is forming, and b) the Fed will finally cut rates in September, triggering a significant rally in t-bonds. And that is a reasonable possibility. However, meanwhile in the here and now, TLT remains very weak and is now entering the weakest seasonal period of the year.
TLT tends to show significant weakness in September and October
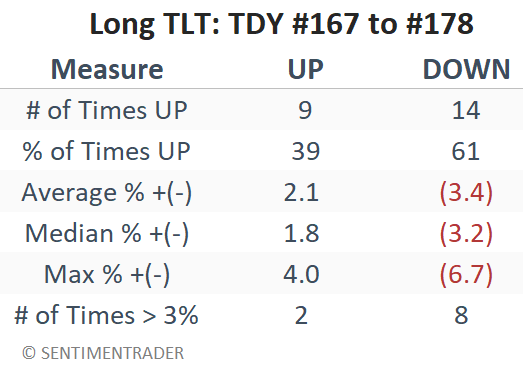
The chart below shows the Annual Seasonal Trend for TLT and a typical seasonal weakness period extending from Trading Day of the Year #167 through TDY #178. For 2025, this period extends from the close on September 3rd through September 18th.
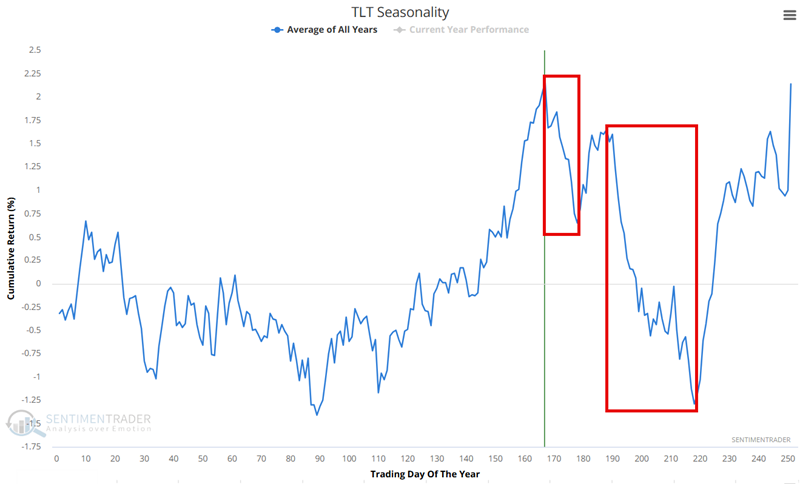
An even more significant weakness occurs from TDY #188 through TDY #218, but we will cross that bridge when we get there. For now, the chart below displays the hypothetical growth of $1 achieved by holding a long position in TLT only during the TDY #167 to TDY #178 period every year since 2002.
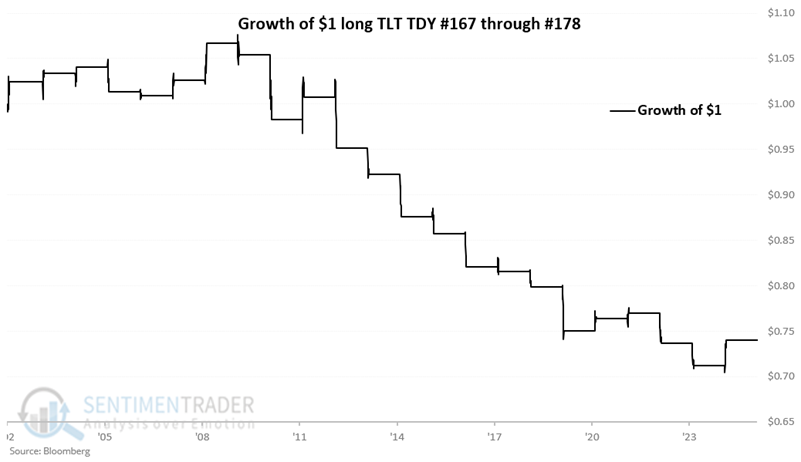
The table below summarizes TLT performance during this period.
An option-based alternative
Shorting shares of TLT involves unlimited risk. Two alternatives for playing the short side are the ProShares UltraShort 20+ Year Treasury ETF (TBT) and the Direxion Daily 20+ Year Treasury Bear 3X Shares (TMF). TBT tracks -2 times a treasury bond index, and TMF tracks -3 times. These ETFs offer significant profit potential but also entail significant downside risk (and potential tracking error) if treasury bonds rally instead of declining.
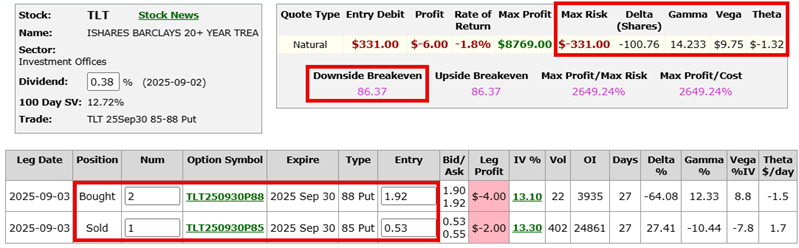
Another alternative is to trade options on TLT. One possibility is to craft a position using a TLT put option position that offers a "Delta" of roughly -100. A delta of -100 implies that the position is roughly equivalent to holding a short position of 100 shares of TLT - but without unlimited risk.
The example trade below involves:
- Buying 2 TLT Sep30 88 strike price puts @ $1.92
- Selling 1 TLT Sep30 85 strike price puts @ $0.53
The screenshots below (courtesy of www.OptionsAnalysis.com) display the particulars and risk curves for this position.
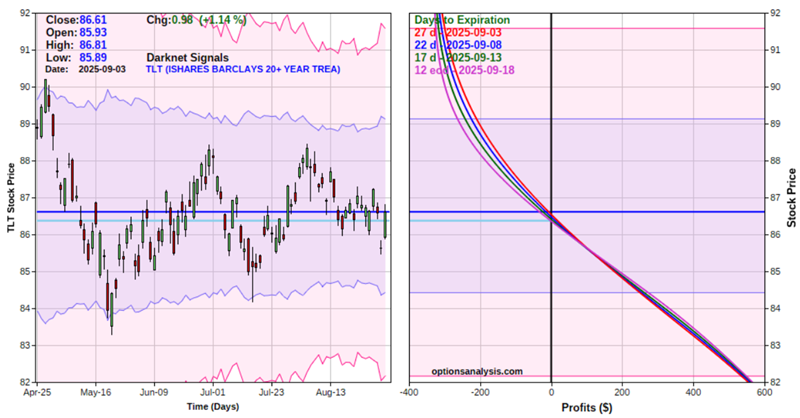
The red line in the chart above represents the expected dollar profit or loss as of September 3rd. The purple line represents the predicted dollar profit or loss as of September 18th (the last day of the unfavorable seasonal period shown above).
Things to note:
- The cost to enter the trade on a 2-by-1 lot is $331. This is also the maximum worst-case loss if TLT rallies.
- The Delta is -100.76. This means that the position's value will lose roughly that much if TLT rises $1 a share in price (and will gain roughly that much if TLT declines $1 a share in price).
- The Gamma is 14.233. This means that the position will gain roughly that many deltas if TLT rises $1 in price (and vice versa).
- The Vega is $9.75. This means that if implied option volatility rises one percentage point, this position will gain roughly that amount.
- The Theta is -$1.32. This means that the position is expected to lose that amount of value due to one day of time decay.
- Note that with TLT trading at $86.61, the downside breakeven price is $86.37. This means that if TLT drops below $86.37, the option position should move point-for-point with TLT shares.
What the research tells us…
TLT has a strong history of showing weakness in September and October. With the potential of a Fed rate cut looming later in September, some traders may be hesitant to play this seasonal tendency. The example option trade above offers a limited risk approach to playing the short side. More aggressive traders may choose to trade leveraged inverse ETFs such as TBT or TMF, or to sell short treasury bond futures instead. A stop-loss point is essential for ETF or futures trades, given the risk of a bearish position with a potential rate cut looming.