
Playing QQQ Signal with Options

In this article, Dean wrote about a Bollinger Band-based buy signal for QQQ after the close on 5/21. This article will detail a few ways to potentially play this opportunity using end-of-day option pricing data for 5/24.
The mission of Sentimentrader.com is not to issue specific buy and sell recommendations but rather to teach investors and traders to trade objectively and not based on emotion. The following should be considered for educational purposes only and not as a specific trading recommendation.
BUYING SHARES of QQQ
The most straightforward way to make a bullish play would be to buy 100 shares of QQQ at $332.51 a share. The cost to enter this trade is $33,251. The risk "curves" for this trade is a straight line, as seen in the chart below.
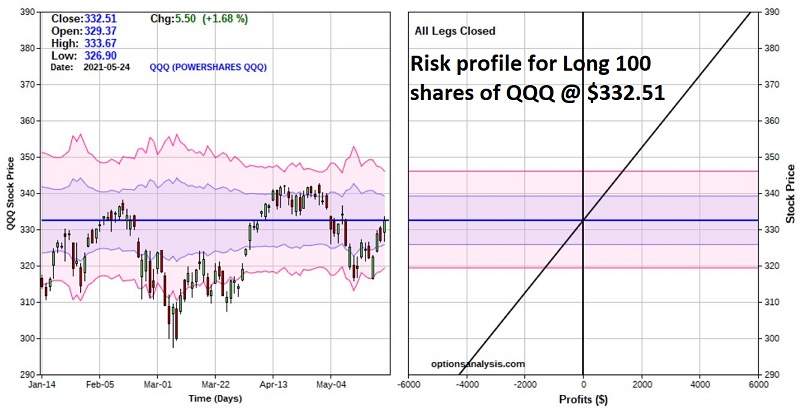
The reason for this straight-line movement is that for each $1 the shares rise in price, the 100 share stock position will gain $100 and vice versa.
Now let's consider a lower cost possibility using options.
THE LONG CALL
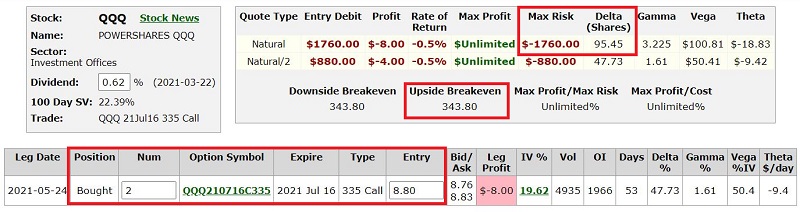
The exit criteria in the article is to hold shares of QQQ for 36 trading days and then sell. This equates to July 14th, two days before the July QQQ option expiration for July 16th (53 calendar days away). The simplest approach here would be to buy a call option. For the sake of example, we will assume the following trade:
- Buy 2 July16 335 QQQ Calls @ $8.80
The particulars of this trade are seen in the screenshot below (all subsequent screenshots are courtesy of www.Optionsanalysis.com).
The chart below displays the risk curves for the long call.
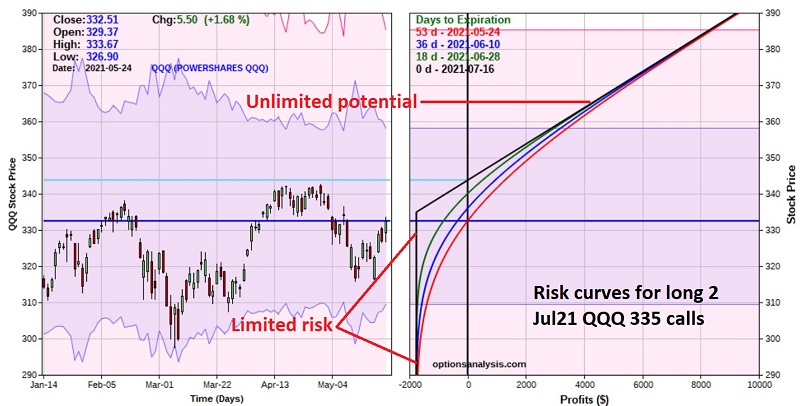
Things to note:
- The cost to enter this trade is $1,760 ($880 x 2-lot)
- The breakeven point, if held until July expiration, is $343.80
- Above the breakeven price, the option will gain point-for-point with the stock
- If QQQ is below 335 at expiration, the trade will lose $1,760
- This trade has a "delta" of 95 (this means that this position will initially act much like a position holding 95 shares of QQQ but at the cost of only $1,760)
The black line in the chart above represents the expected dollar profit or loss at expiration based on the price of QQQ at the time. The colored lines represent the expected dollar profit or loss at different dates before expiration. Note that the sooner QQQ would start to rally, the higher the interim profit potential.
A trader who bought this call may NOT necessarily intend to hold it until expiration. If QQQ rallies sooner than later, the trader may:
- Sell early to capture a profit
- If buying more than a 1-lot, the trader may sell some portion of his or her position
- Adjust an existing trade to lock in some profit while still hoping for larger gains
COMPARING THE SHARE POSITION TO THE OPTION POSITION
The chart below overlays the two risk curves shown above to allow you to view the difference in the risk/reward profiles.
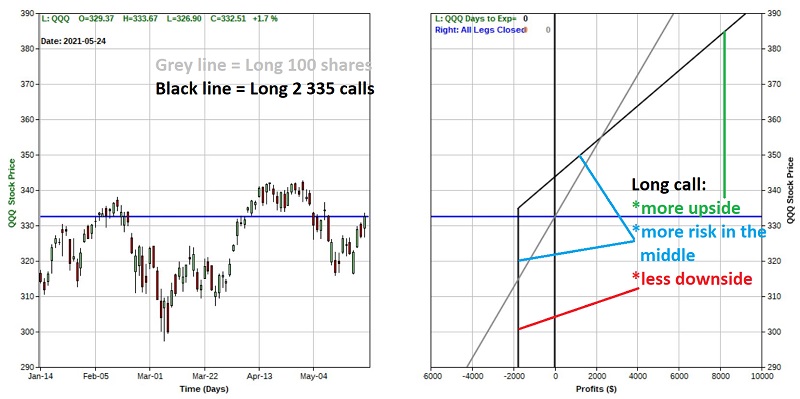
Note that:
- Above roughly $355.25, the call option position has greater profit potential than the 100 shares position
- Below roughly $315.38, the call option position will lose less than the 100 shares position
- Between the two prices listed above, the call option position has less profit potential/greater loss potential than the 100 shares position
The potential risk in the middle range for the call option is due to "time decay" - i.e., the fact that options give up their time premium as expiration gets closer.
The good news is that the call option:
- Requires a commitment of only $1,760 instead of $33,521
- Enjoys greater profit potential if QQQ rallies significantly
- Enjoys limited risk if QQQ falls apart
The bad news is that because of time decay, if the option position is held all the way through July options expiration AND QQQ is exactly unchanged in price:
- The 100 shares position will have no gain or loss
- The call option position will lose -$1,760
SUMMARY
One cannot definitively state that "the option trade is better" nor that "buying shares of QQQ is better." One can only realistically assess the relative pros and cons and decide what makes the most sense for themselves.