Products
SentimenTrader Trading Tools
‍
Backtest Engine
My Trading Toolkit
Correlation Analysis
Seasonality
Indicators & Data API
‍
Proprietary Indicators & Charts
Market Data API
Strategies & Scanner
‍
50+ Trading Strategies
Smart Stock Scanner
Research Reports
‍
Research Solutions
Reports Library
Free Resources
Simple Backtest Calculator
Simple Seasonality Calculator
The Kelly Criterion Calculator
Sentiment Geo Map
Public Research Reports
Education
Sentiment Indicators
Technical Indicators
Pricing
Company
About
In the News
Testimonials
Client Success Stories
Contact
Log inLoginSign up
< BACK TO ALL REPORTS

Pinned in the Discouragement phase of a Typical Sentiment Cycle

Jason Goepfert
2022-10-04
A correlation of price action to a Typical Sentiment Cycle shows that investors have been pinned in the Discouragement phase of the cycle for months. When it has gotten this bad, for this long, the S&P 500 showed positive 6-month returns every time but once, in 1932.

Key points:

  • A correlation of price action to the Typical Sentiment Cycle shows that investors are discouraged
  • They've been pinned in this phase for months on end
  • When sentiment has been discouraged for this long, stocks typically rallied over the next 6 months

Investors have been discouraged for months, with no sign of returning confidence

The Typical Sentiment Cycle shows that investors have mostly given up and are woefully discouraged.

A popular heuristic uses some version of the Cycle popularized by Justin Mamis in his 1999 book, The Nature of Risk. The Mamis chart encompasses the price path of U.S. stocks from roughly May 1990 through March 1991. 

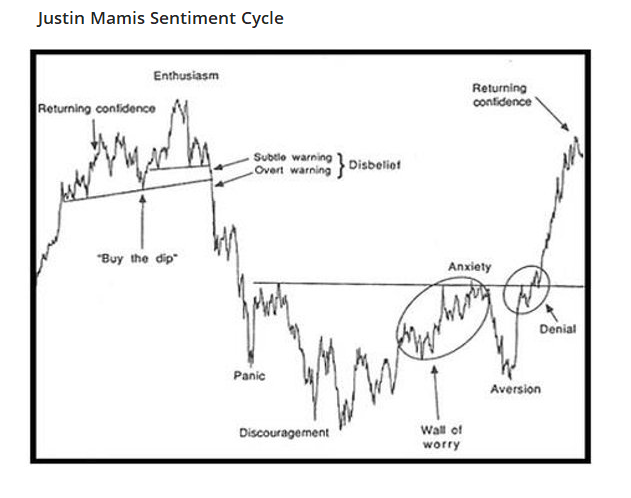
There are essentially 4 major parts to the cycle:

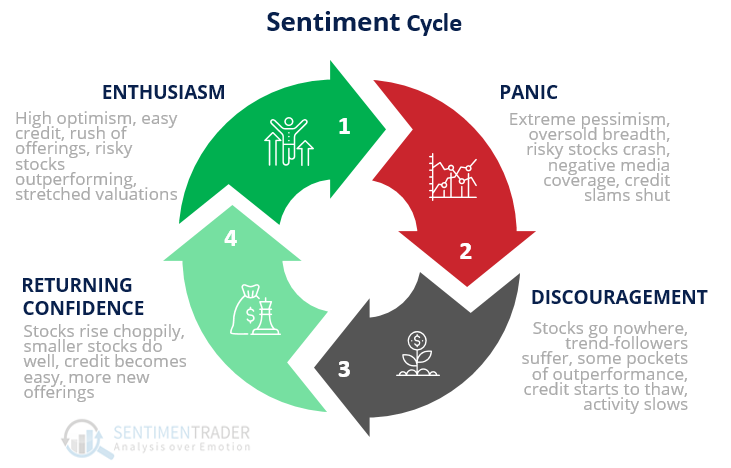
1. Enthusiasm - High optimism, easy credit, a rush of offerings, risky stocks outperforming, stretched valuations

2. Panic - Extreme pessimism, oversold breadth, risky stocks crash, negative media coverage, credit slams shut

3. Discouragement - Stocks go nowhere, trend-followers suffer, some pockets of outperformance, credit starts to thaw, activity slows

4. Returning Confidence - Stocks rise choppily, smaller stocks do well, credit becomes easy, more new offerings

When we looked at this in mid-March, it was apparent that the probability we were in the Panic phase was rising rapidly. Stocks bounced for a few weeks, then rolled over again.

That disappointing price action caused us to move past the Panic phase and into the Discouragement one, where it has been stuck for months. Discouragement is basically the opposite of Returning Confidence, so it's no surprise that the two have been pinned at opposite extremes.

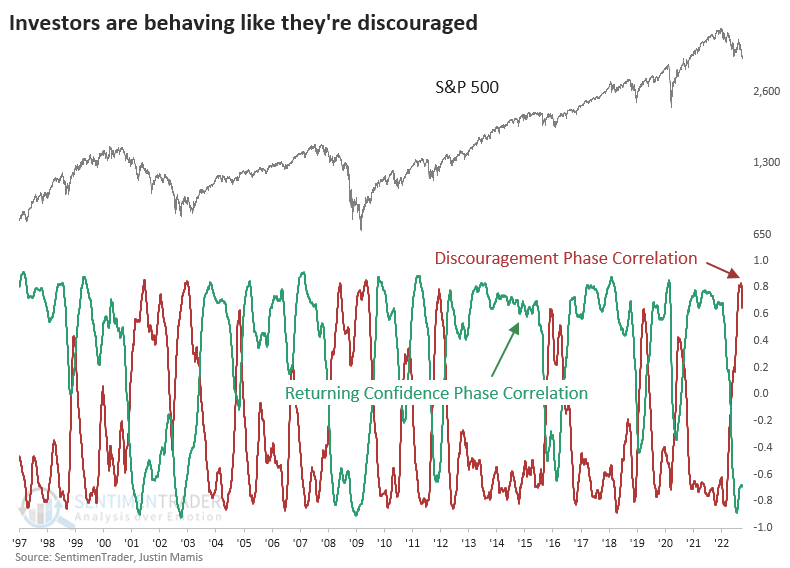
If we add those two correlations together and look over the past 90+ years, we see that the current reading is quite extreme. In the chart, we combine them and average the readings over the past three months.

When it has gotten this discouraging, for this long, stocks rallied over the next six months. Out of the ten signals, only the one from 1932 preceded a negative six-month return. The signal in 1947 gave up its gains during the subsequent six months, but the others preceded sustained gains.

What the research tells us...

No two market cycles are ever exactly alike, and investors never behave in exactly the same way. But human emotion is about the most stable market force out there, and people generally react in a similar way to price action. Based on how they've behaved in recent months, they've reached a point of extreme discouragement. That has been a boon for long-term returns.

Sorry, you don't have access to this report

Upgrade your subscription plan to get access
Go to Dasboard
PRODUCTS
SentimenTrader
Trading Tools
Indicators & Data API
‍
Strategies & Scanner
‍
Research Reports
FREE
RESOUrCES
Simple Backtest
Calculator
Simple Seasonality
Calculator
The Kelly Criterion
Calculator
Sentiment Geo Map
‍
Public Research Reports
‍
Education
Sentiment Indicators
‍
Technical Indicators
‍
Pricing
Bundle pricing
‍
FAQ
‍
Announcements
‍
COMPANY
‍
About
‍
In the News
‍
Testimonials
‍
Client Success Stories
CONTACT
‍
General Inquiries
‍
Media Inquiries
‍
Financial Professionals Inquiries
‍
© 2026 Sundial Capital Research Inc. All rights reserved.
Setsail Marketing
TermsPrivacyAffiliate Program
Risk Disclosure: Futures and forex trading contains substantial risk and is not for every investor. An investor could potentially lose all or more than the initial investment. Risk capital is money that can be lost without jeopardizing ones’ financial security or life style. Only risk capital should be used for trading and only those with sufficient risk capital should consider trading. Past performance is not necessarily indicative of future results.

Hypothetical Performance Disclosure: Hypothetical performance results have many inherent limitations, some of which are described below. No representation is being made that any account will or is likely to achieve profits or losses similar to those shown; in fact, there are frequently sharp differences between hypothetical performance results and the actual results subsequently achieved by any particular trading program. One of the limitations of hypothetical performance results is that they are generally prepared with the benefit of hindsight. In addition, hypothetical trading does not involve financial risk, and no hypothetical trading record can completely account for the impact of financial risk of actual trading. for example, the ability to withstand losses or to adhere to a particular trading program in spite of trading losses are material points which can also adversely affect actual trading results. There are numerous other factors related to the markets in general or to the implementation of any specific trading program which cannot be fully accounted for in the preparation of hypothetical performance results and all which can adversely affect trading results.

Testimonial Disclosure: Testimonials appearing on this website may not be representative of other clients or customers and is not a guarantee of future performance or success.