Philly Fed Prices Paid Index Spike

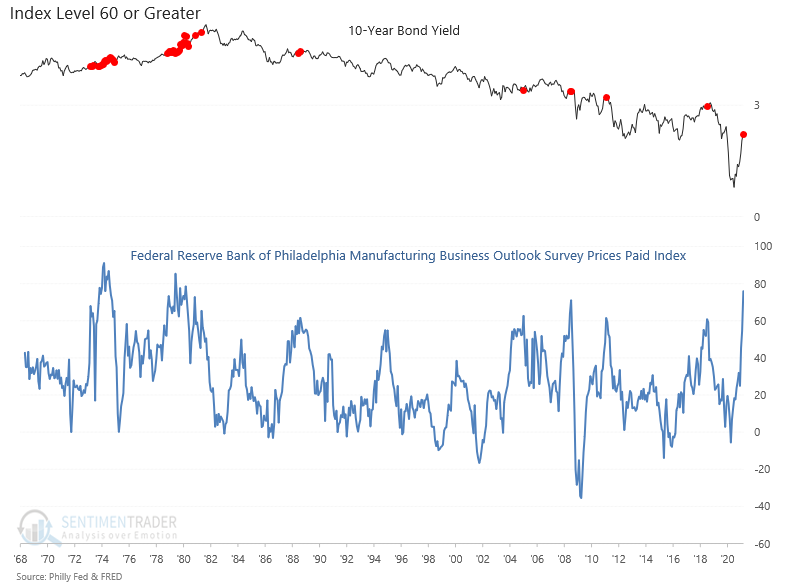
The Federal Reserve Bank of Philadelphia released its manufacturing business outlook survey for March today. The prices paid index increased from 54.4 to 75.9 on a m/m basis. This is the highest reading since March 1980.
Let's see what history has to say about bonds, stocks, and commodities when the Philly Fed Prices Paid Index crosses above 60.
Prices Paid Index
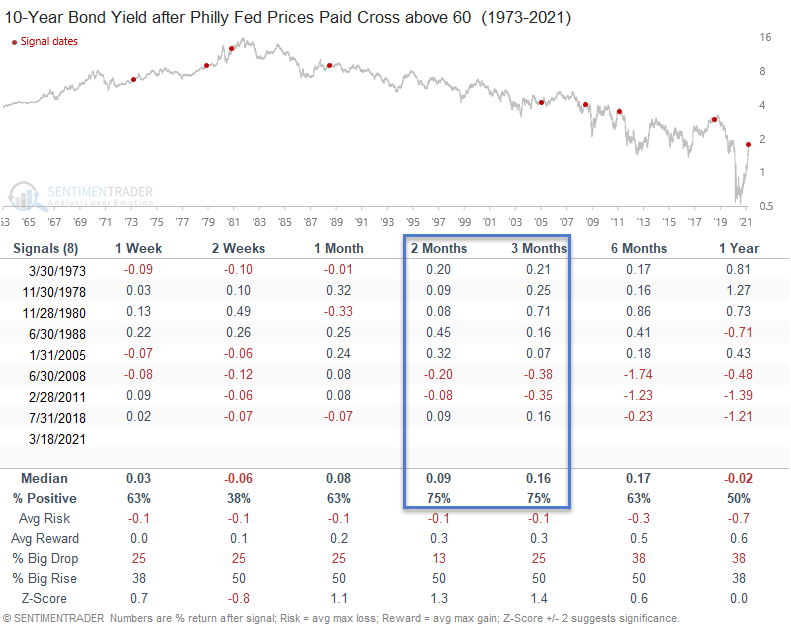
Bond Yields
Please note, the table reflects the net change in bond yields.
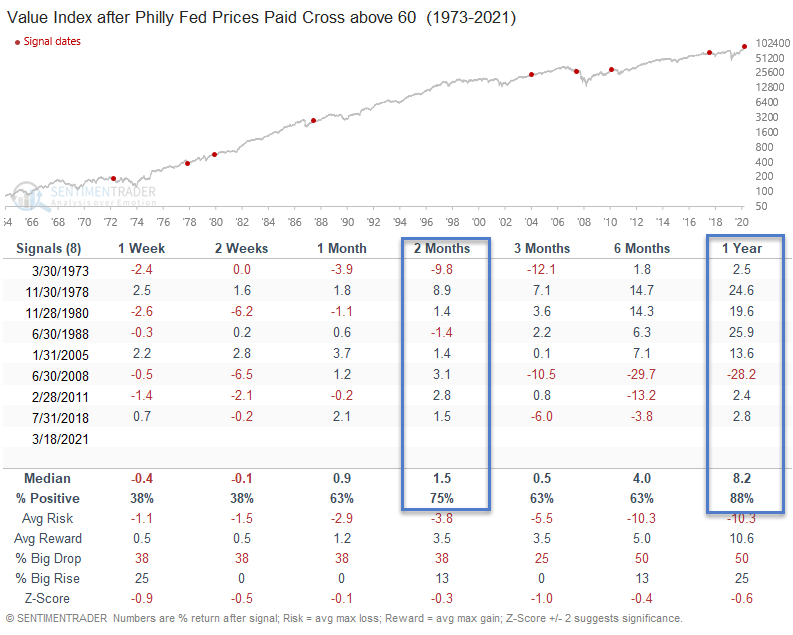
Value Stocks
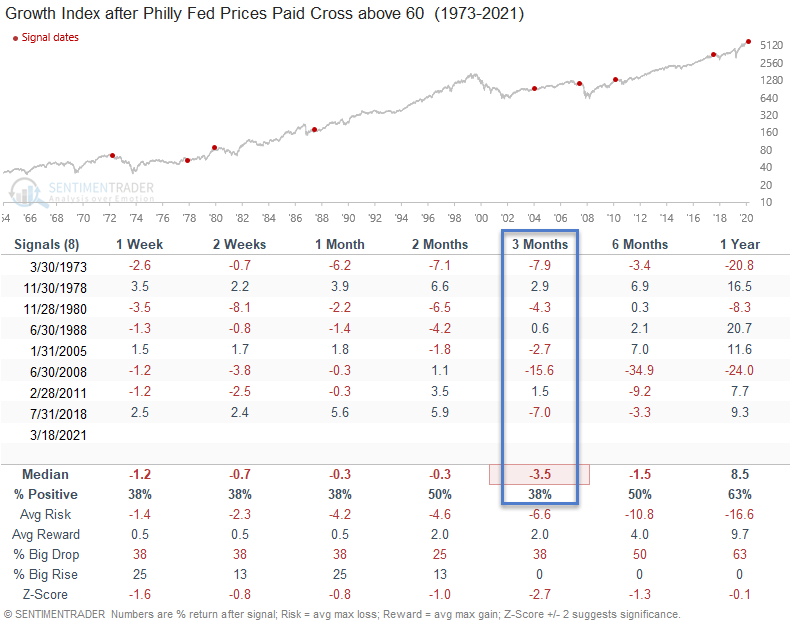
Growth Stocks
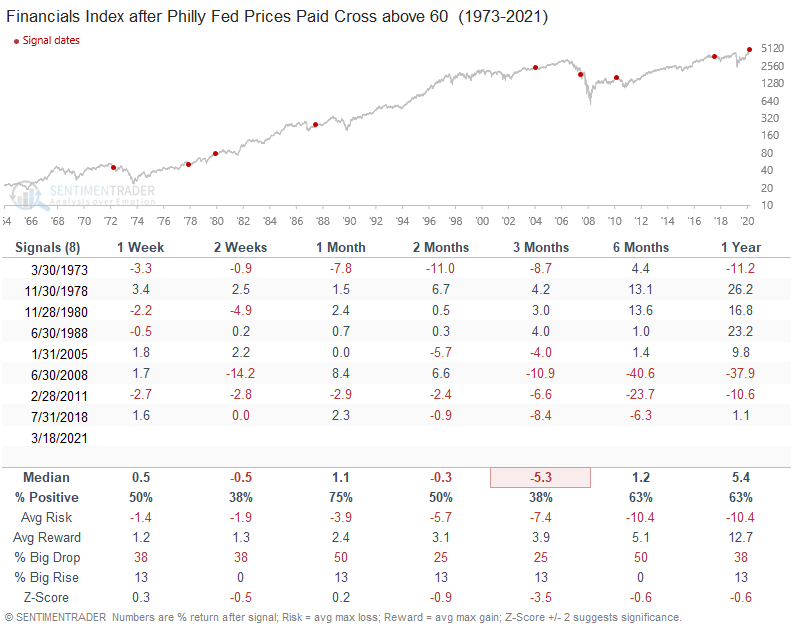
Financial Stocks
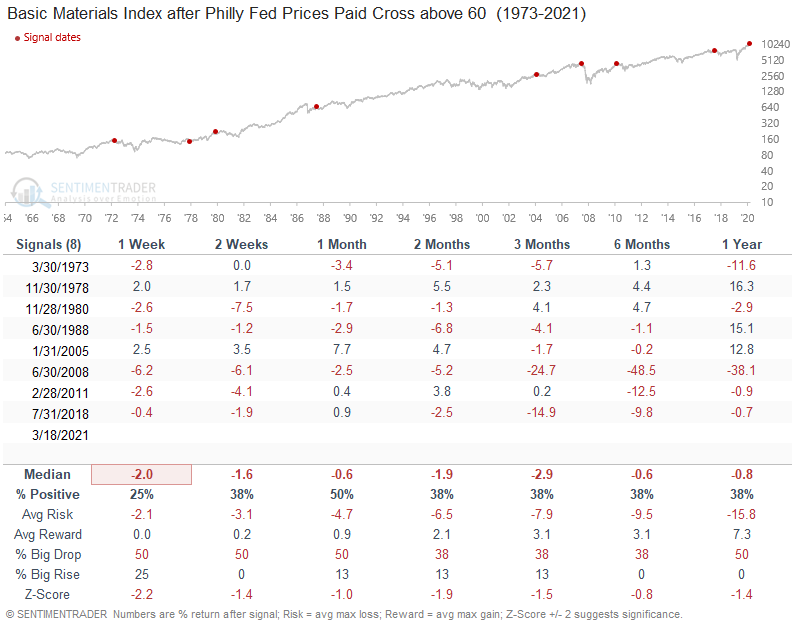
Materials Stocks
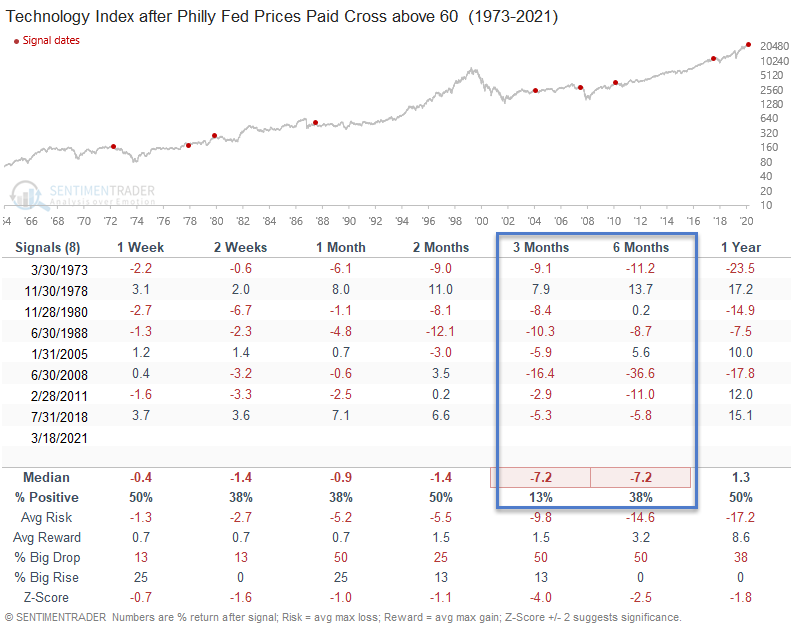
Technology Stocks
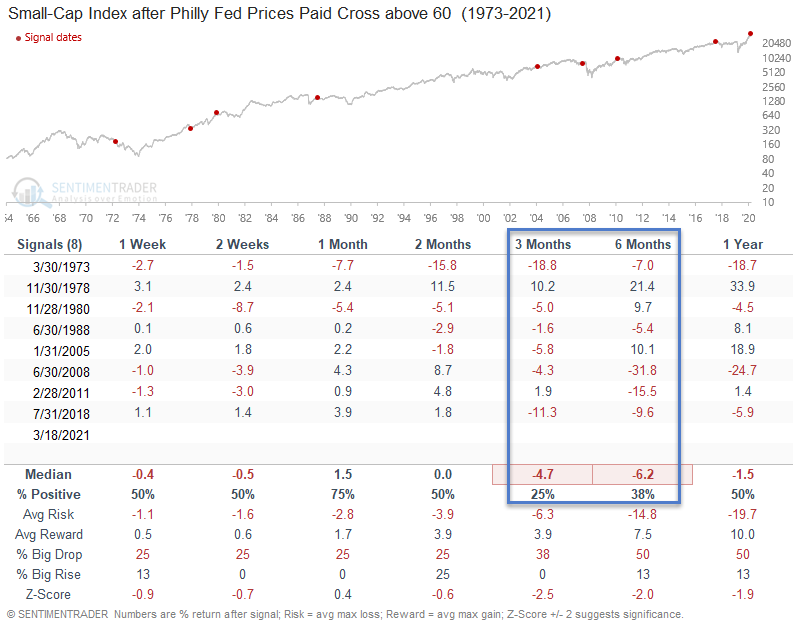
Small-Cap Stocks
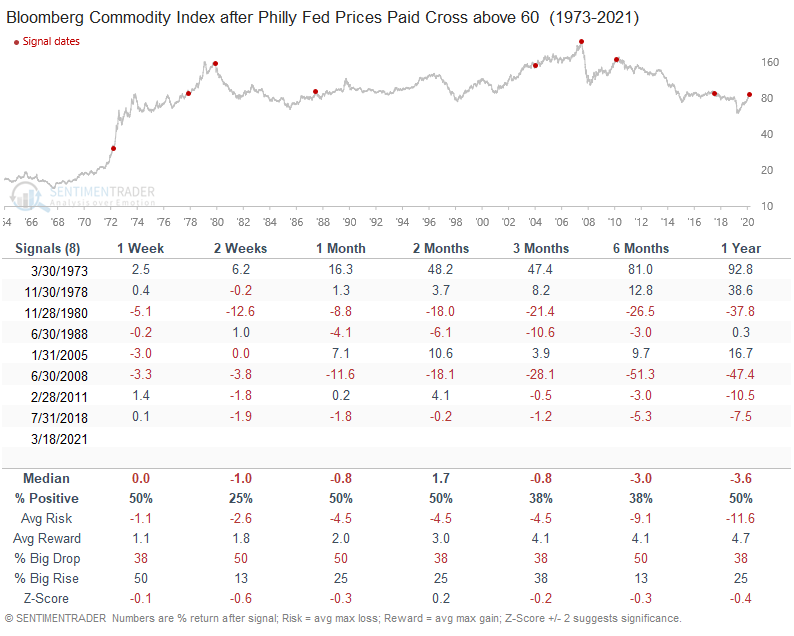
 Commodities
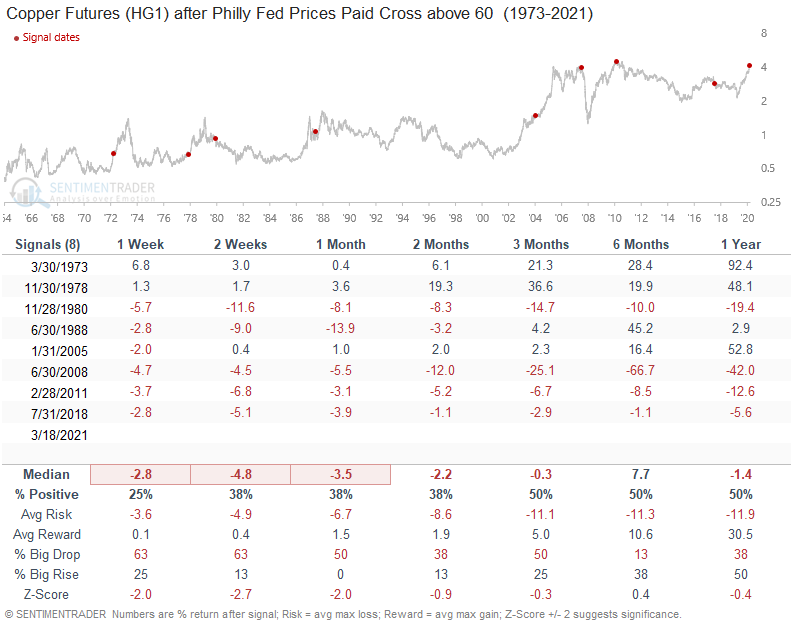
Copper
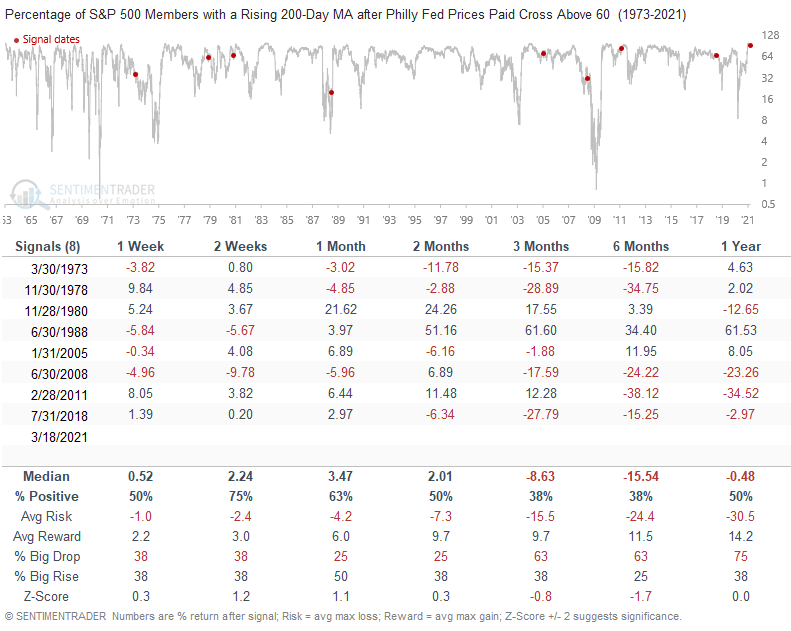
Market Breadth
Please note, the table reflects the net change in the members with a rising 200-day moving average.