
Pessimism in the energy sector is reversing from an elevated level

Key points:
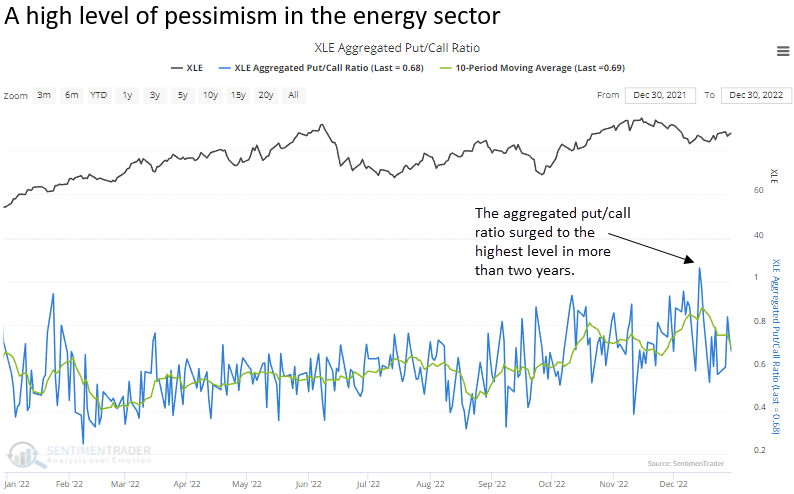
- S&P 500 energy sector constituent put volume increased relative to call volume
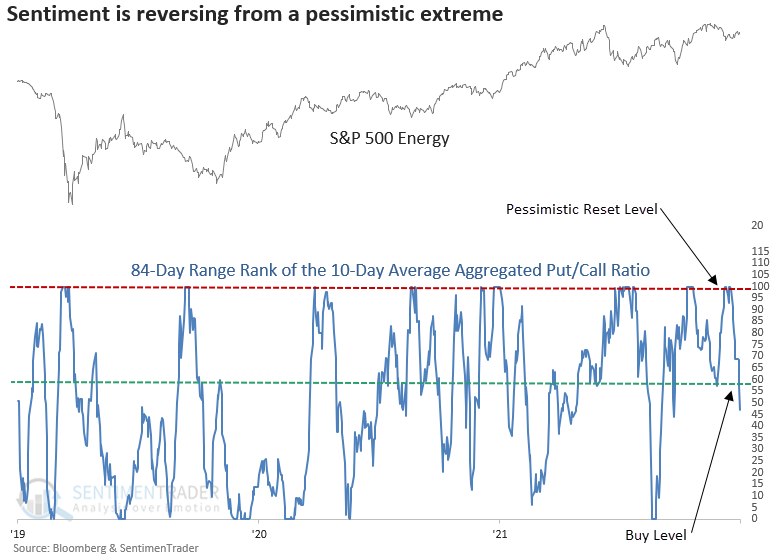
- A model based on the aggregated put/call ratio for the energy sector triggered a new alert
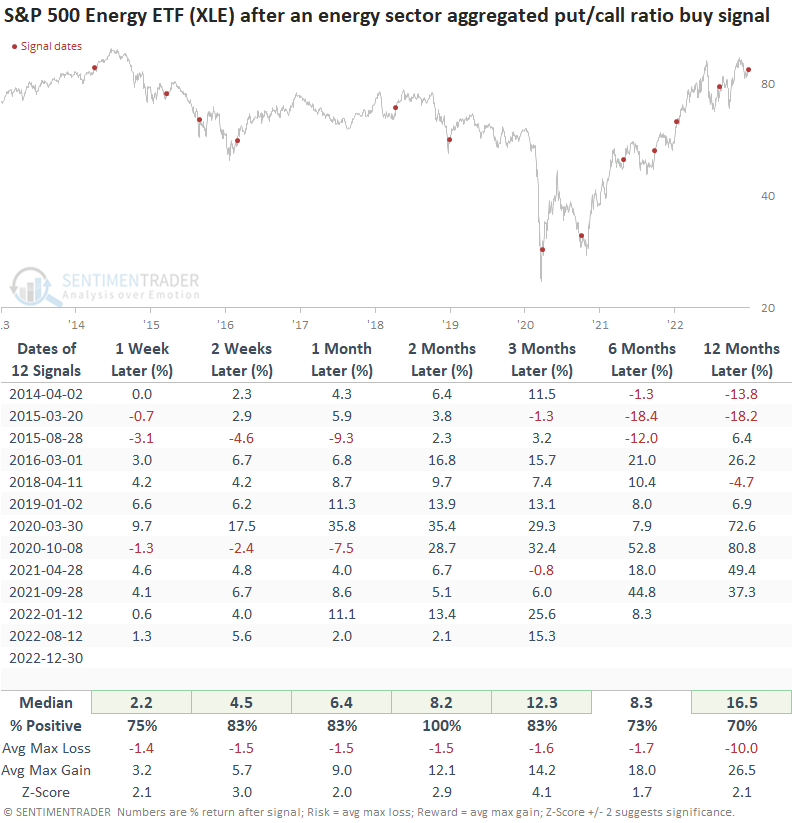
- After other buy signals, energy stocks rallied 100% of the time two months later
The aggregated put-call ratio as a contrary sentiment indicator
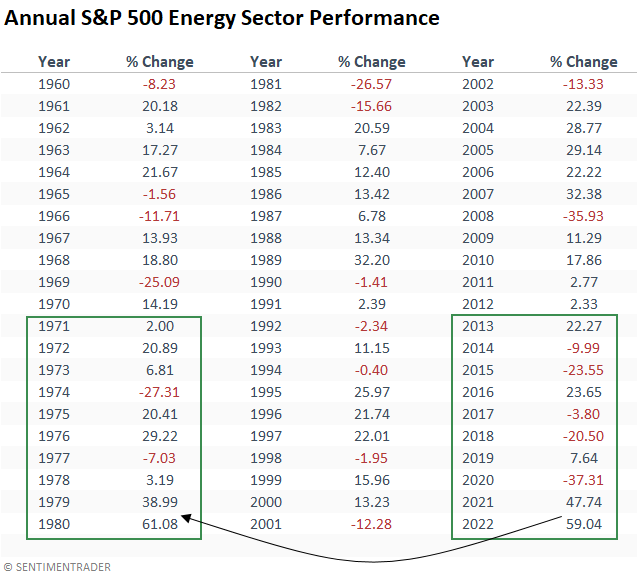
The S&P 500 energy sector rose 59% in 2022, outpacing the robust 47% gain in 2021. The annual results are the best consecutive years since 1979-80.
While it's fun to speculate why traders bought more puts relative to calls, a model-driven approach removes the narrative and follows the signal. The history for the SentimenTrader aggregated option volume data is limited. However, it's hard to argue with the premise of options data as a contrary sentiment indicator and the performance results.
The aggregated put/call ratio for the S&P 500 energy sector surged and subsequently reversed lower, triggering a buy signal for energy stocks at the close of trading on 2022-12-30.
A trading model that identifies a reversal in the aggregated put/call ratio
The model applies an 84-day range rank to the 10-day moving average of the S&P 500 energy sector aggregated put/call ratio. The range rank indicator measures the current value relative to all other values over a lookback period. 100 is the highest, and 0 is the lowest. The pessimistic reset condition occurs when the range rank for the average put/call ratio exceeds the 99th percentile. A new buy signal triggers when the range rank falls below the 57th percentile and ETF momentum turns positive.
Similar reversals in the aggregated put/call ratio preceded gains 100% of the time
The model generated a signal 12 other times over the past nine years. After the others, XLE future returns, win rates, and z-scores were excellent across all time frames, especially two months later. While most signals had the benefit of a bull market, the model performed well on a short-term basis during the challenging 2014-16 period.
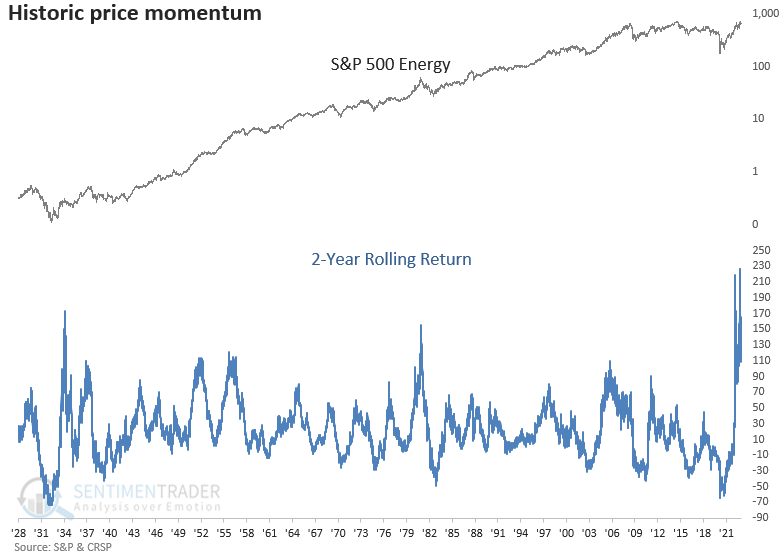
The big picture environment for energy stocks
The big question for long-term energy stock investors is whether the significant gains over the last two years represent the start of a new cycle or the end, like in 1980. Suppose one compares the annual returns in the decade leading up to the peak in the energy sector in 1980, which also aligns with a top in the broader market, to the current environment. In that case, the last two years look more like the start of a new cycle. However, one must be mindful that energy stock outperformance could be interrupted by a recession, similar to 1974 and 1981.
Over the last two years, price momentum surged to the highest level in history. If the upswing suggests a new energy stock bull market was born, one should keep in mind that a significant amount of performance appears priced into the energy sector. Remember, overbought markets can correct through price or time.
What the research tells us...
As a trader, I aim to buy oversold or pessimistic conditions in established uptrends. Rinse and repeat. After a 12% correction within an established uptrend, the energy sector's aggregated put/call ratio spiked and reversed lower, triggering a buy signal with a 100% win rate. From a big-picture perspective, one must be mindful that a significant amount of performance appears priced into energy stocks after a multi-year surge. So, whether a trader or a long-term investor, stay nimble.