
Persistent selling pressure reverses

Key points:
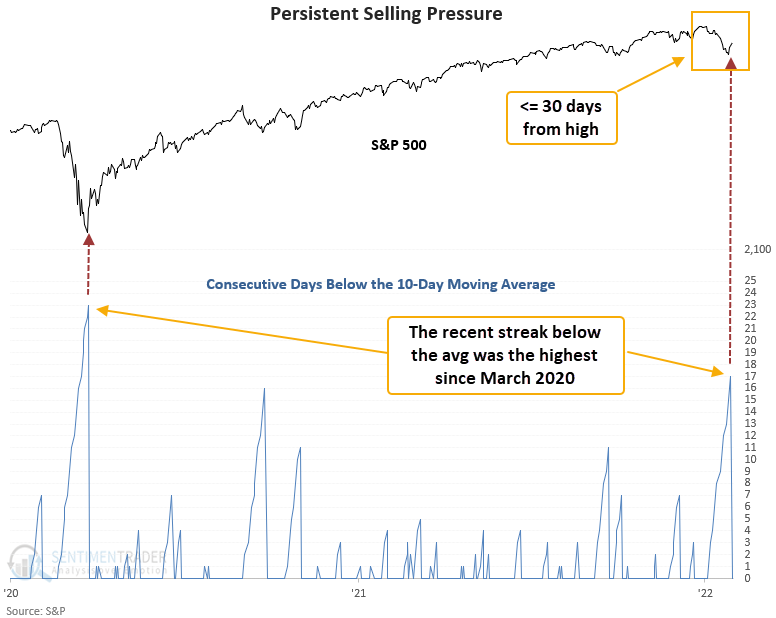
- The S&P 500 index closed below its 10-day average for 17 consecutive days
- On Monday, the index closed above the average
- Large-cap stocks show a tendency to mean revert higher in the near term
Can the market continue to bounce after persistent selling pressure reverses
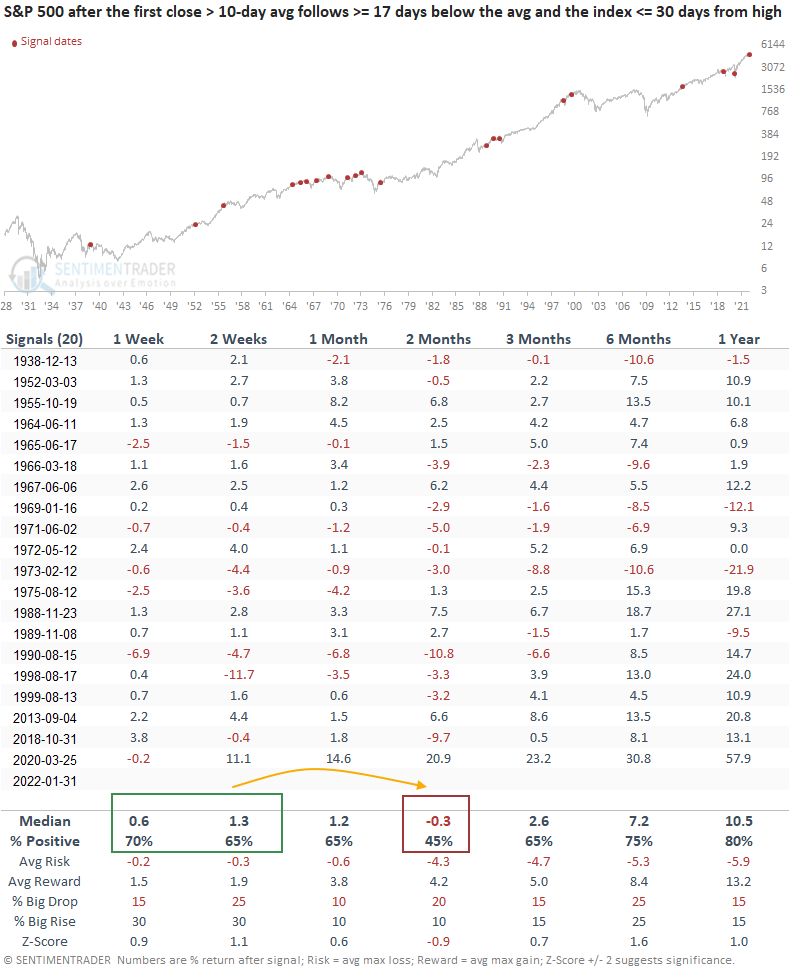
Let's assess the outlook for the S&P 500 when the index closes above its 10-day average after trading below the average for 17 consecutive days or more. And, I will require the index to be <= 30 days from a 252-day high to identify instances similar to the current signal.
The S&P 500 shows better results and win rates in the near term
This signal triggered 20 other times over the past 84 years. After the others, S&P 500 future returns and win rates suggest stocks can continue to bounce in the near term. However, the 2-month time frame shows that it's not uncommon to retest capitulation lows. I would also keep an open mind to scenarios like 1998 or 2018. i.e., we could have another leg down with a similar magnitude to the first correction leg.
What the research tells us...
When the S&P 500 trades below its 10-day average for 17 consecutive days or more and then closes above the average, the reversal in selling pressure suggests stocks can mean revert higher. Similar setups to what we're seeing now have preceded rising stock prices with better than random results and win rates in the near term.