
Performance of the Bloomberg Commodity Spot Index

Key Points:
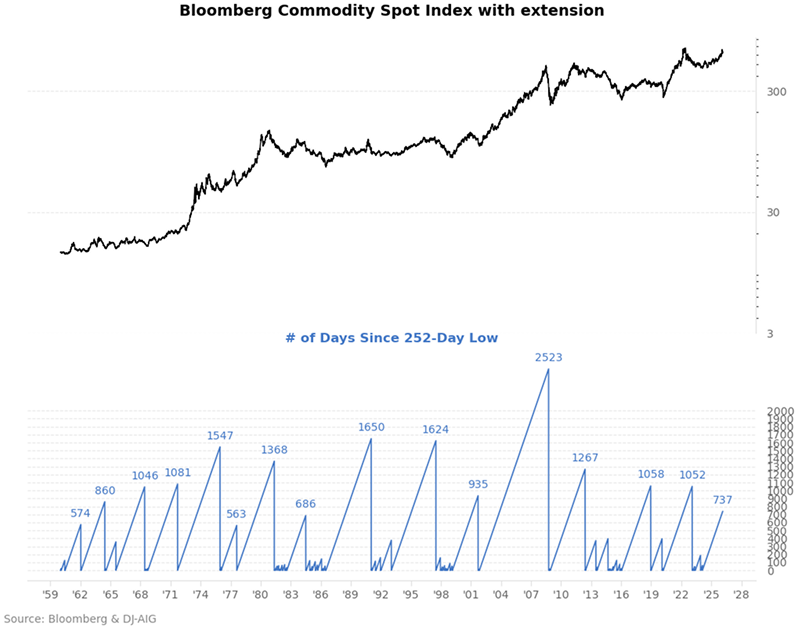
- The Bloomberg Commodity Spot Index has not closed at a 252-day low for approximately 750 consecutive days
- Such extreme bottomless cycles have occurred only 13 times over the past 60+ years
- Similar market conditions indicate a high probability of positive returns in the medium term
Extreme Trend Cycles in Commodities
The Bloomberg Commodity Spot Index has demonstrated exceptional price resilience over the past two years or so, consistently refusing to break down to the downside. The streak of not hitting a 1-year (252-day) low has stretched to nearly 750 days, triggering a rare cycle extreme signal on February 19, 2026.
As officially defined by Bloomberg, the index-formerly known as the Dow Jones-UBS Commodity Spot Index-measures price movements of commodities included in the Bloomberg Commodity Index and some of its sub-indices, excluding the impact of rolling futures contracts or costs associated with holding physical commodities, and is quoted in US dollars.
The last time the commodity index triggered a similar signal of not breaking below its 1-year low was in March 2022. Following that signal, commodity prices maintained strong upward momentum in the medium term but experienced a significant pullback over the subsequent 12 months.
Historical Signals Validate High Probability of Medium-Term Upside for Commodities
Using historical backtesting statistics, we analyzed the full historical performance of the stringent signal where the Bloomberg Commodity Spot Index goes over 700 days without touching a 252-day low.Related Backtest Click Here.
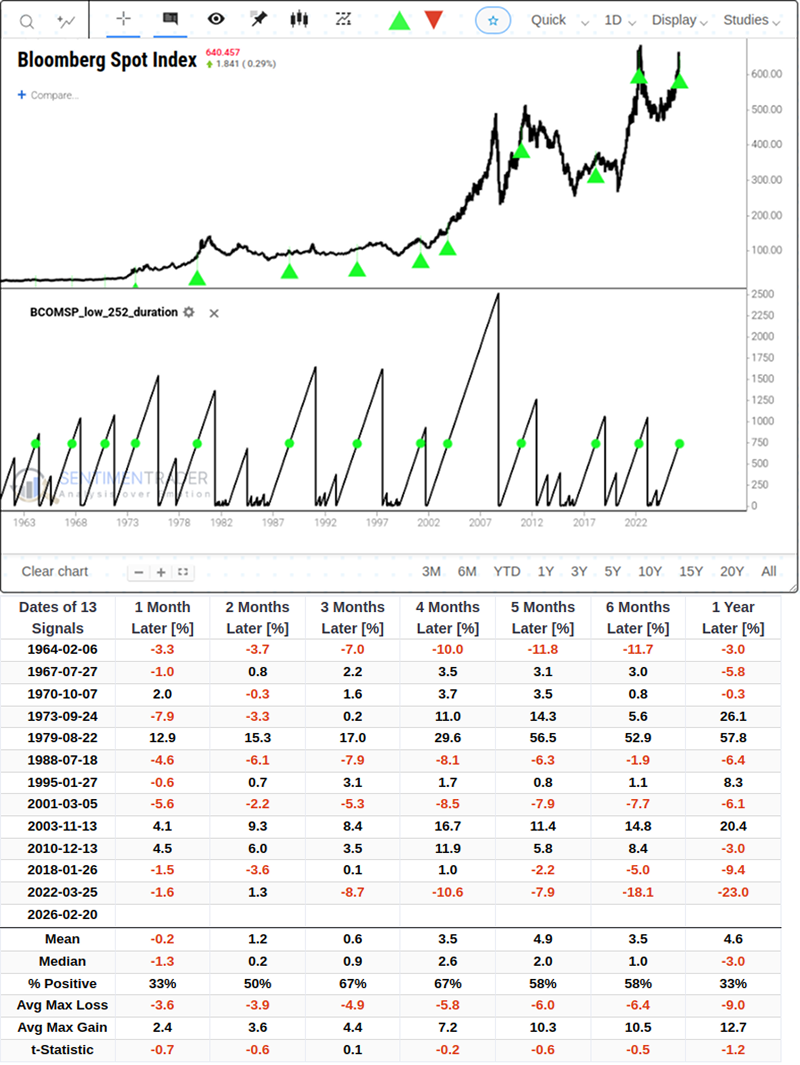
Since 1964, this criterion has been met only 13 times. In the 3 to 4-month window following signal triggers, the index exhibited trend persistence in both return rates and win rates: the probability of rising reached 67%, with the median return peaking at 2.6%.
However, it is important to note that the win rate remained at 33% both one month and one year after the signal was triggered. This highlights the volatility of the market in both the short and long term.
When assessing market opportunities, it is crucial to look beyond end-of-period returns and also observe the volatility path during the period.
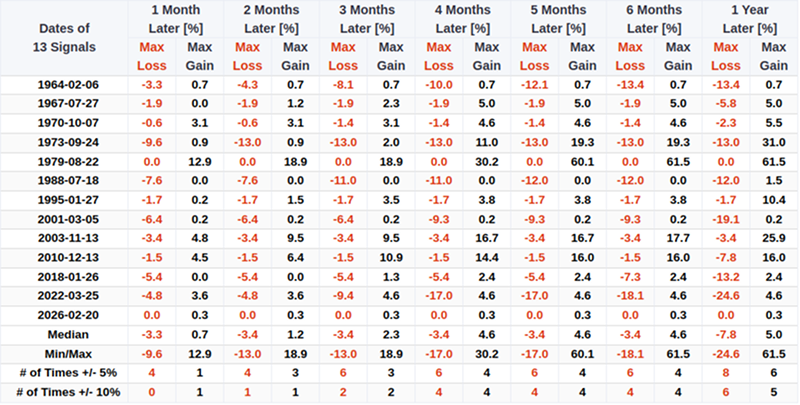
In the medium term, data shows that the median maximum gain within 4 months is 4.6%, while the median maximum loss is limited to -3.4%. This means that driven by trend inertia, the medium-term upside potential typically exceeds downside volatility, resulting in a favorable risk-reward ratio overall.
However, when extending the observation window to 1 year, the tail characteristics of downside risk become sharply evident. Although the average maximum gain over a 1-year period is 12.7%, the average maximum loss also widens to -9.0%. More notably, looking at extreme historical cases: after the two signal triggers in 2001 and 2022, commodities suffered maximum losses of -19.1% and -24.6% respectively over the subsequent year.
Historical data also highlights non-negligible long-term pullback risks. One year after the signal trigger, the win rate for commodities to maintain gains plummets to 33%, the median return turns negative at -3.0%, and the average maximum drawdown reaches -9.0%.
Notably, historical data indicates that such extreme cycle signals for commodities have not significantly weighed on equity markets over the same period.
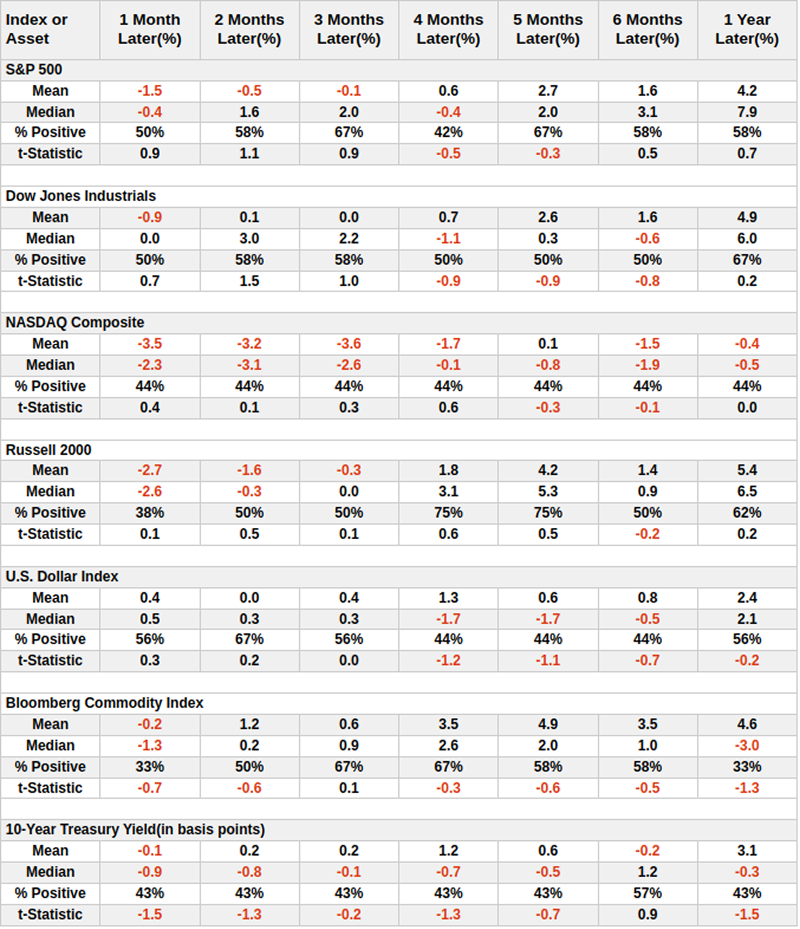
Both the Russell 2000 and S&P 500 indices maintained a high probability of positive returns in the medium to long term following these signals.
Near-Term Support and Mid-Year Headwind Warnings
Beyond the aforementioned long-term trend signals, we also need to incorporate the seasonal patterns of commodity price volatility into our analysis. As an asset class, commodities tend to react strongly to changes in macroeconomic data (such as fluctuations in inflation expectations).
The chart below shows the annual seasonal trend of the Bloomberg Commodity Spot Index.
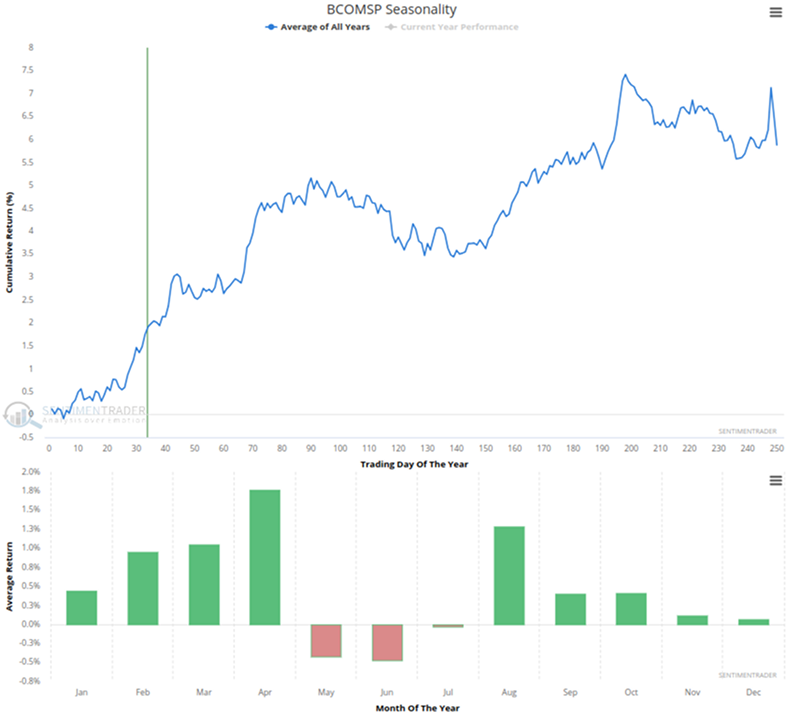
Combined with the current calendar period, commodities are currently in a historically favorable upward phase on average. Bar chart data shows that March and April are typically strong months with tailwinds, with April posting the highest historical average return at nearly 1.8%.
What the Research Tells Us……
When the Bloomberg Commodity Spot Index goes nearly 750 consecutive days without hitting a 1-year low, historical experience suggests that commodity prices will likely continue to rise in the medium term, supported by trend inertia and seasonal tailwinds, with potential medium-term gains outweighing retracement risks.
At the same time, given the extremely long period that has elapsed since the index's last bottom, historical evidence also objectively indicates that the long-term upward momentum for commodities may be gradually depleting. Over the subsequent 6 to 12 months, the win rate drops off a cliff, and commodities face significant risks of deep drawdowns. It is important to note that statistical probabilities based on small-sample historical data are intended to provide contextual reference for market cycles, rather than absolute predictions of future trends. While following the medium-term trend, investors should remain rationally vigilant of long-term mean reversion risks in conjunction with the macroeconomic environment.