
Perfect weeks don't happen in bear markets

Key points:
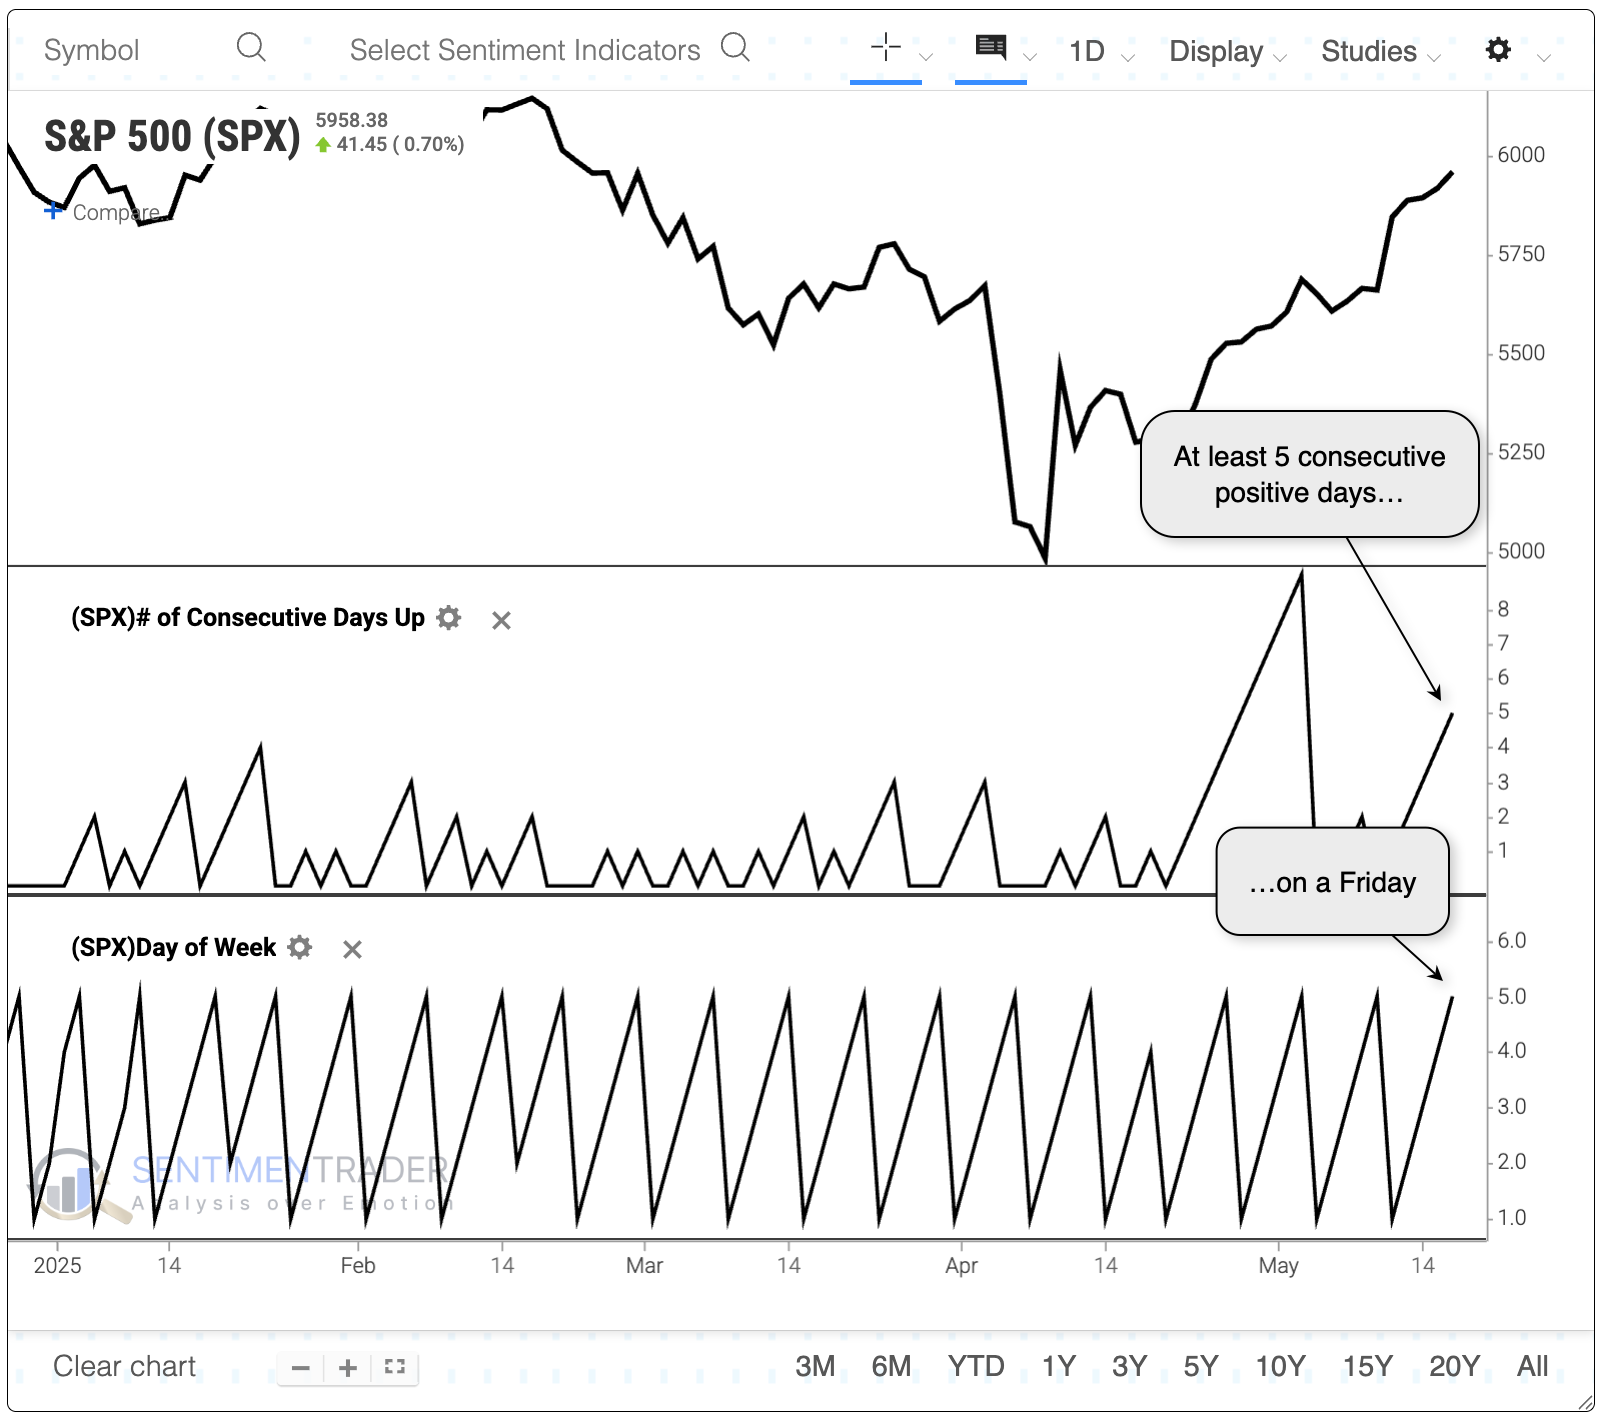
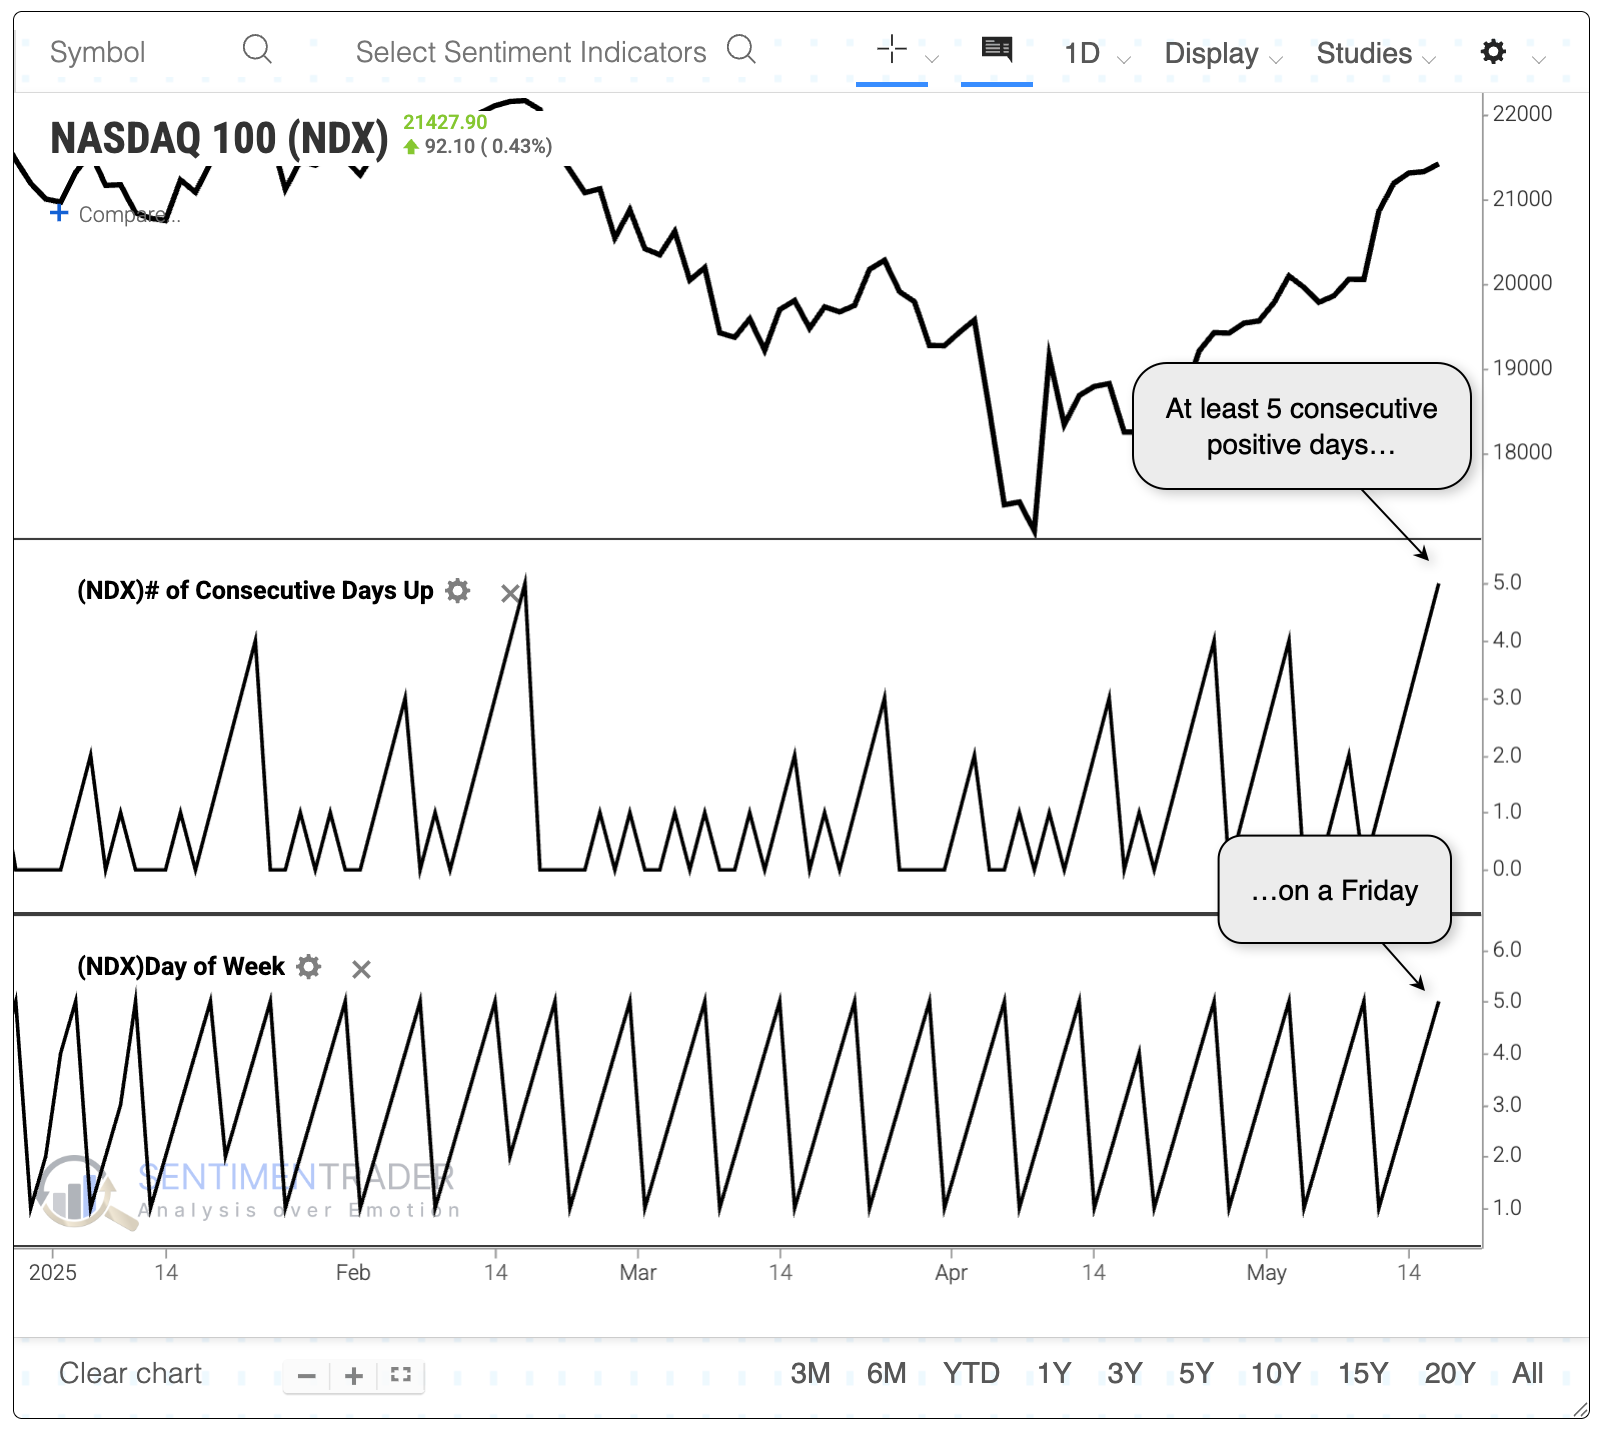
- The S&P 500 and Nasdaq 100 both enjoyed perfect weeks, rising every day of a 5-day calendar week
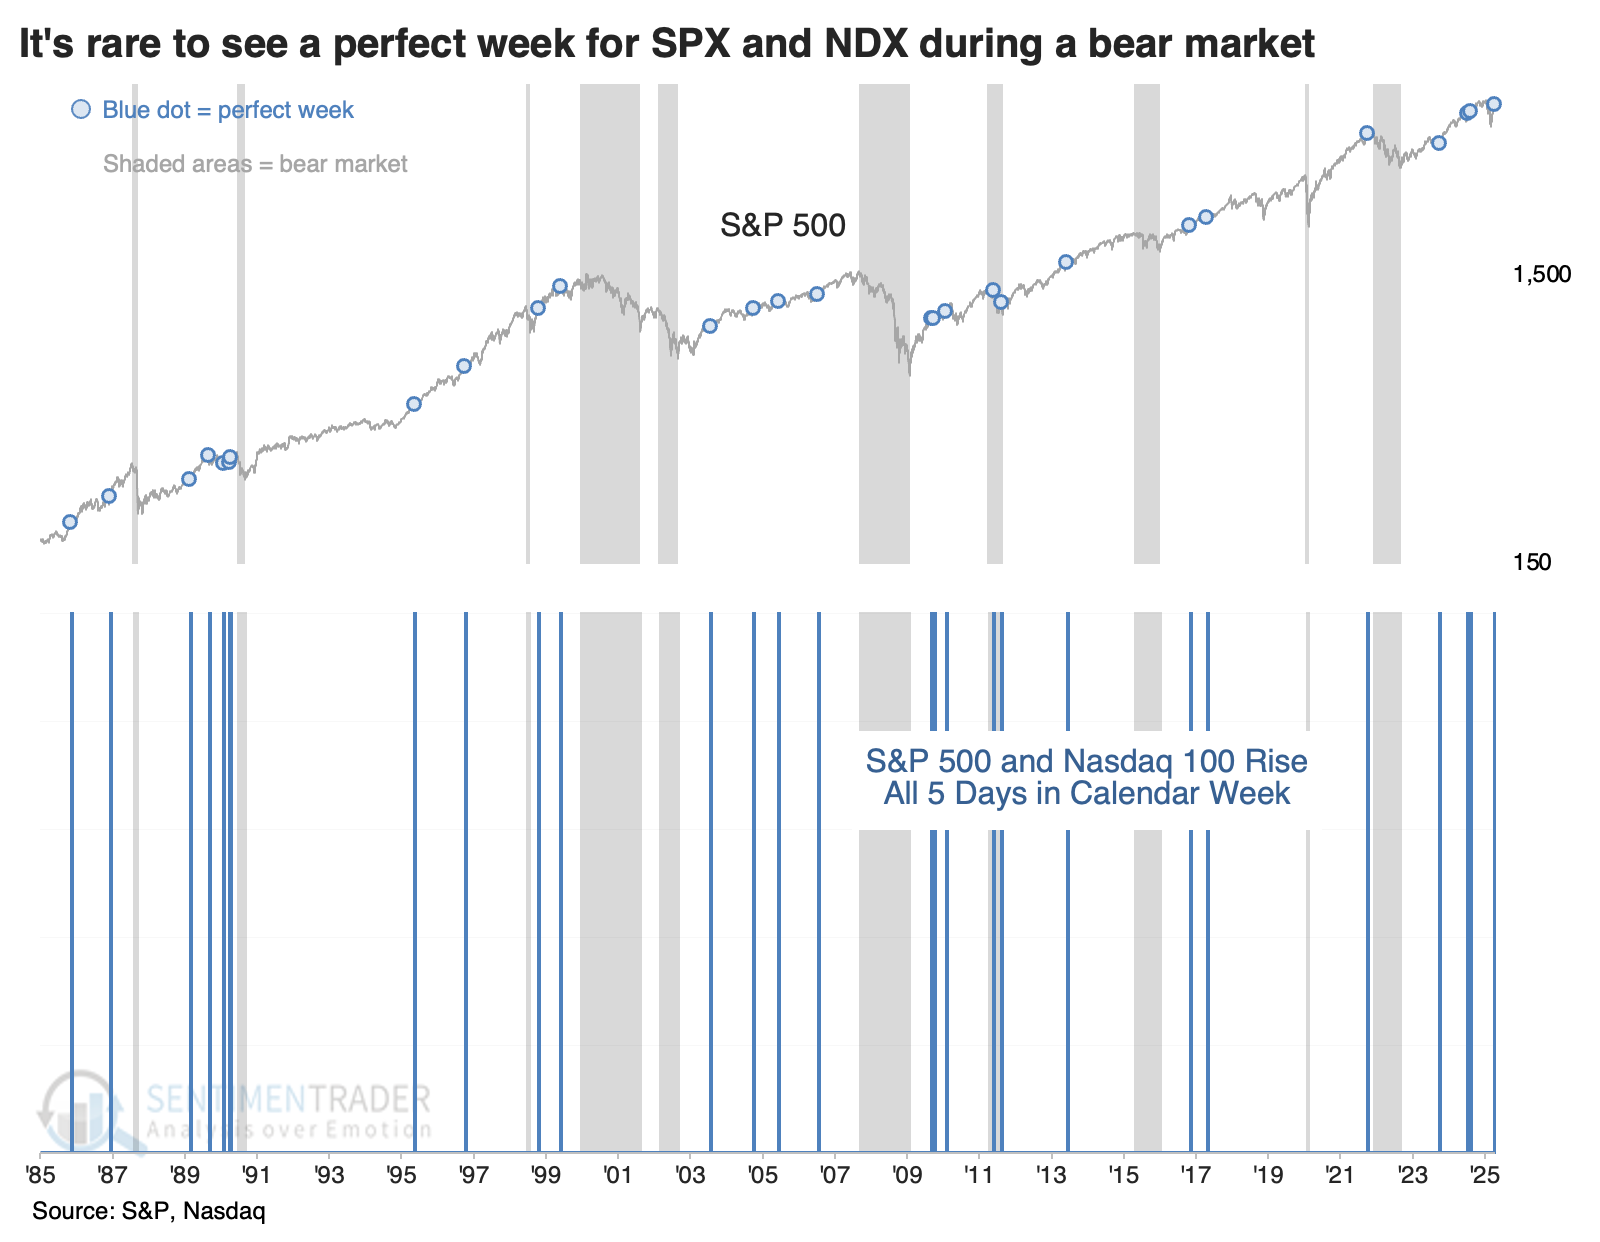
- Perfect weeks don't happen in bear markets, or at least they haven't before
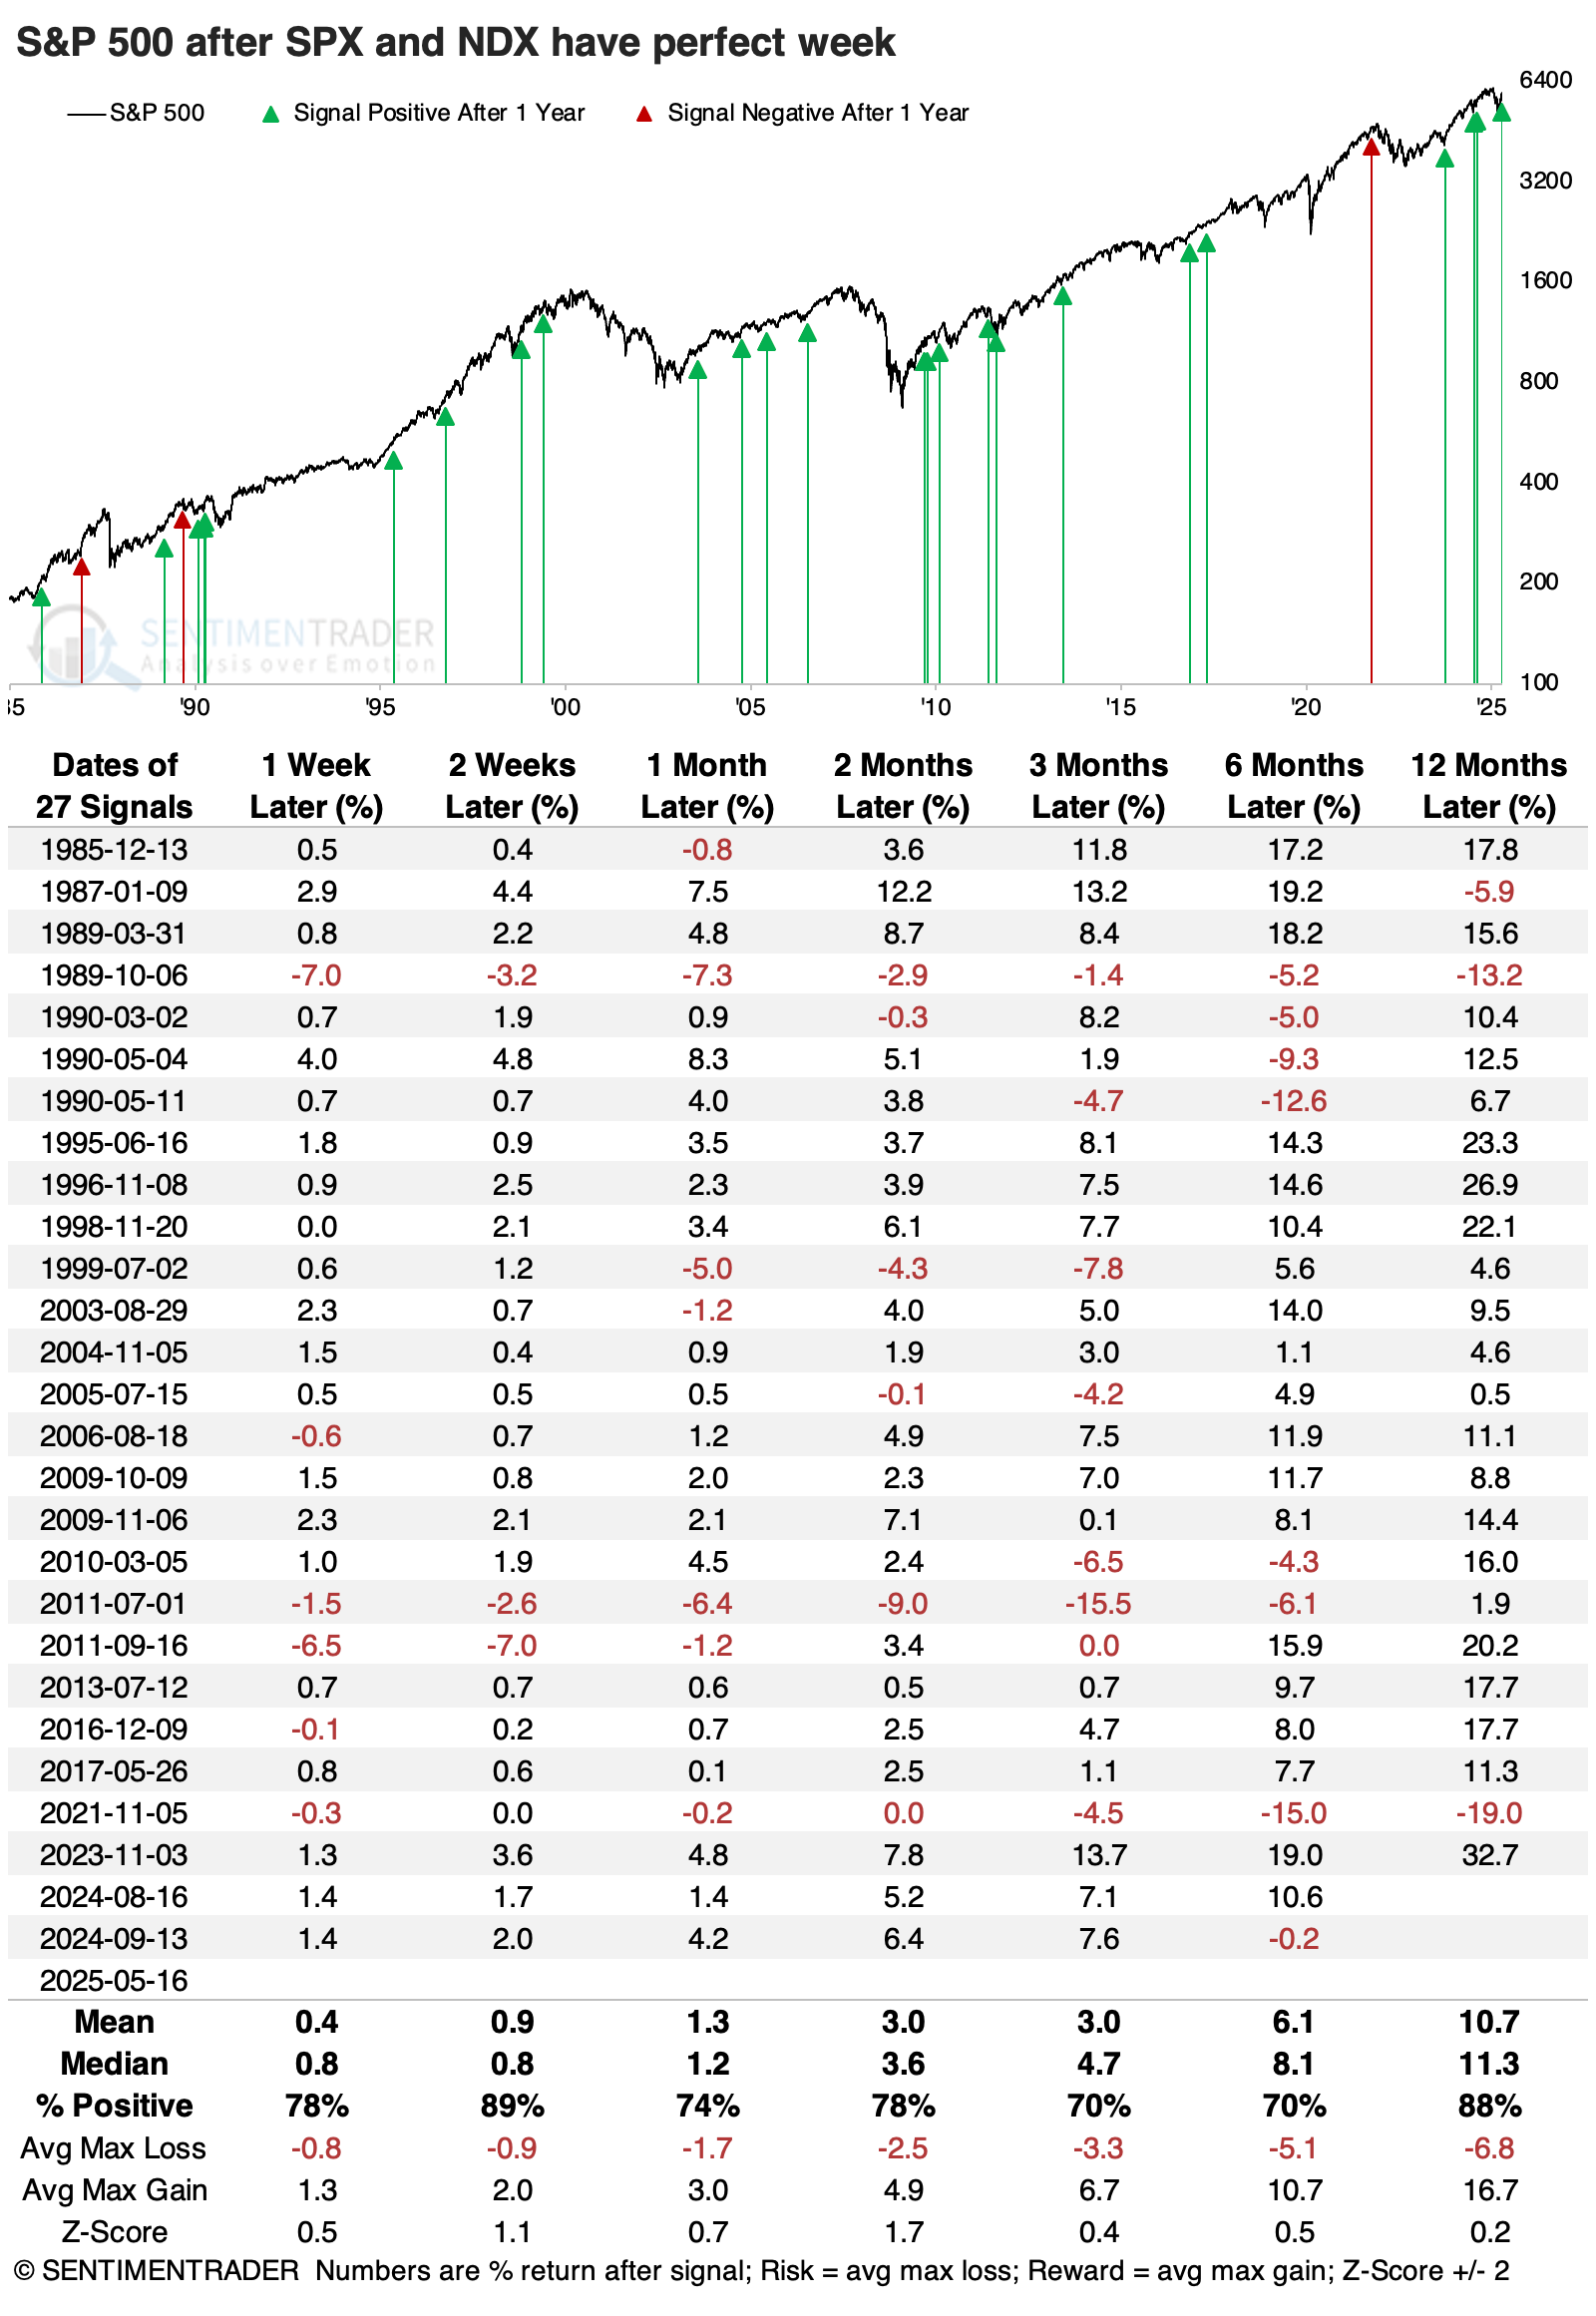
- Forward returns for both indices have been above-average after perfect weeks (especially large ones)
A perfect week, with emphasis
In what would have been inconceivable for most investors a little over a month ago, the S&P 500 and Nasdaq 100 just enjoyed perfect weeks. They both managed to rise every day of a 5-day workweek, and with good gains to boot.
This was the S&P's 2nd-longest winning streak of the year.
It tied the Nasdaq's longest streak since last August.
During ongoing bear markets, investors tend to get too nervous to allow both indices to enjoy perfect weeks. We use Ned Davis Research's (NDR) definition of a bear market, which is somewhat different from the common definition of a 20% decline from a 52-week high.
A perfect week triggered in 2011, which was not a bear market according to the 20% threshold definition, but was according to NDR. Outside of that instance, a dual perfect week never happened during an ongoing bear market.
A promising sign for forward returns
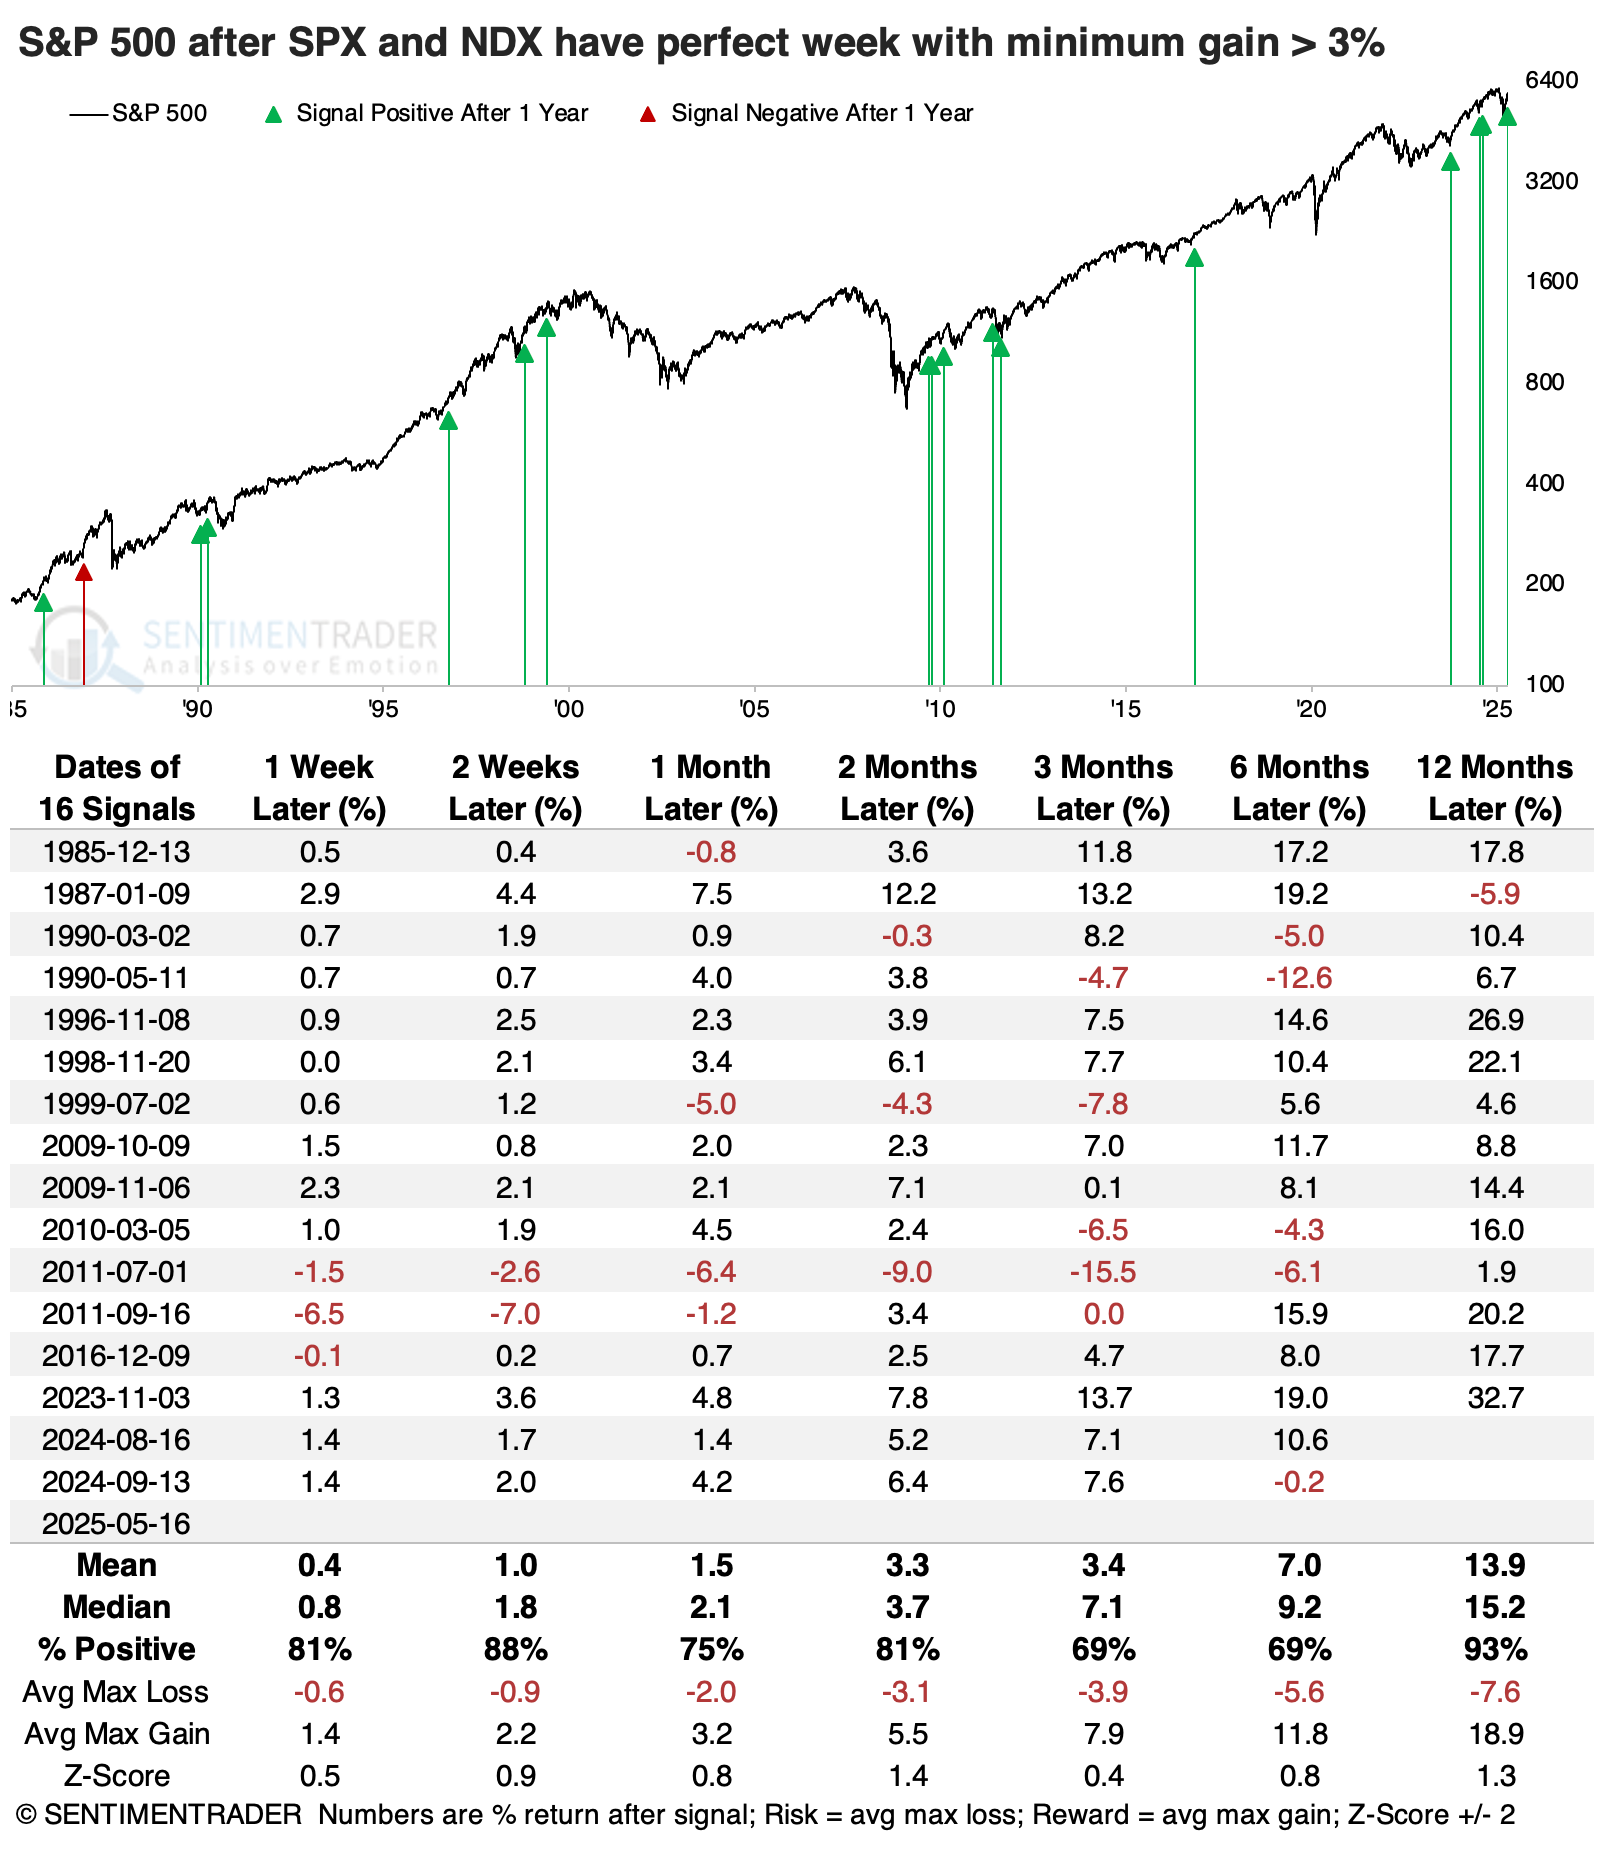
When both indices score a perfect week, the S&P 500's returns were above average in the months ahead. Even two weeks later, the S&P rose 89% of the time, with only 3 losing signals versus 24 winning ones. The worst signal was the one that triggered right before the 2022 bear market when the S&P was about flat over the following two months, then cratered.
The Nasdaq 100 fared even better after these dual perfect weeks. Two months later, it was higher 85% of the time, with an average return significantly above random.
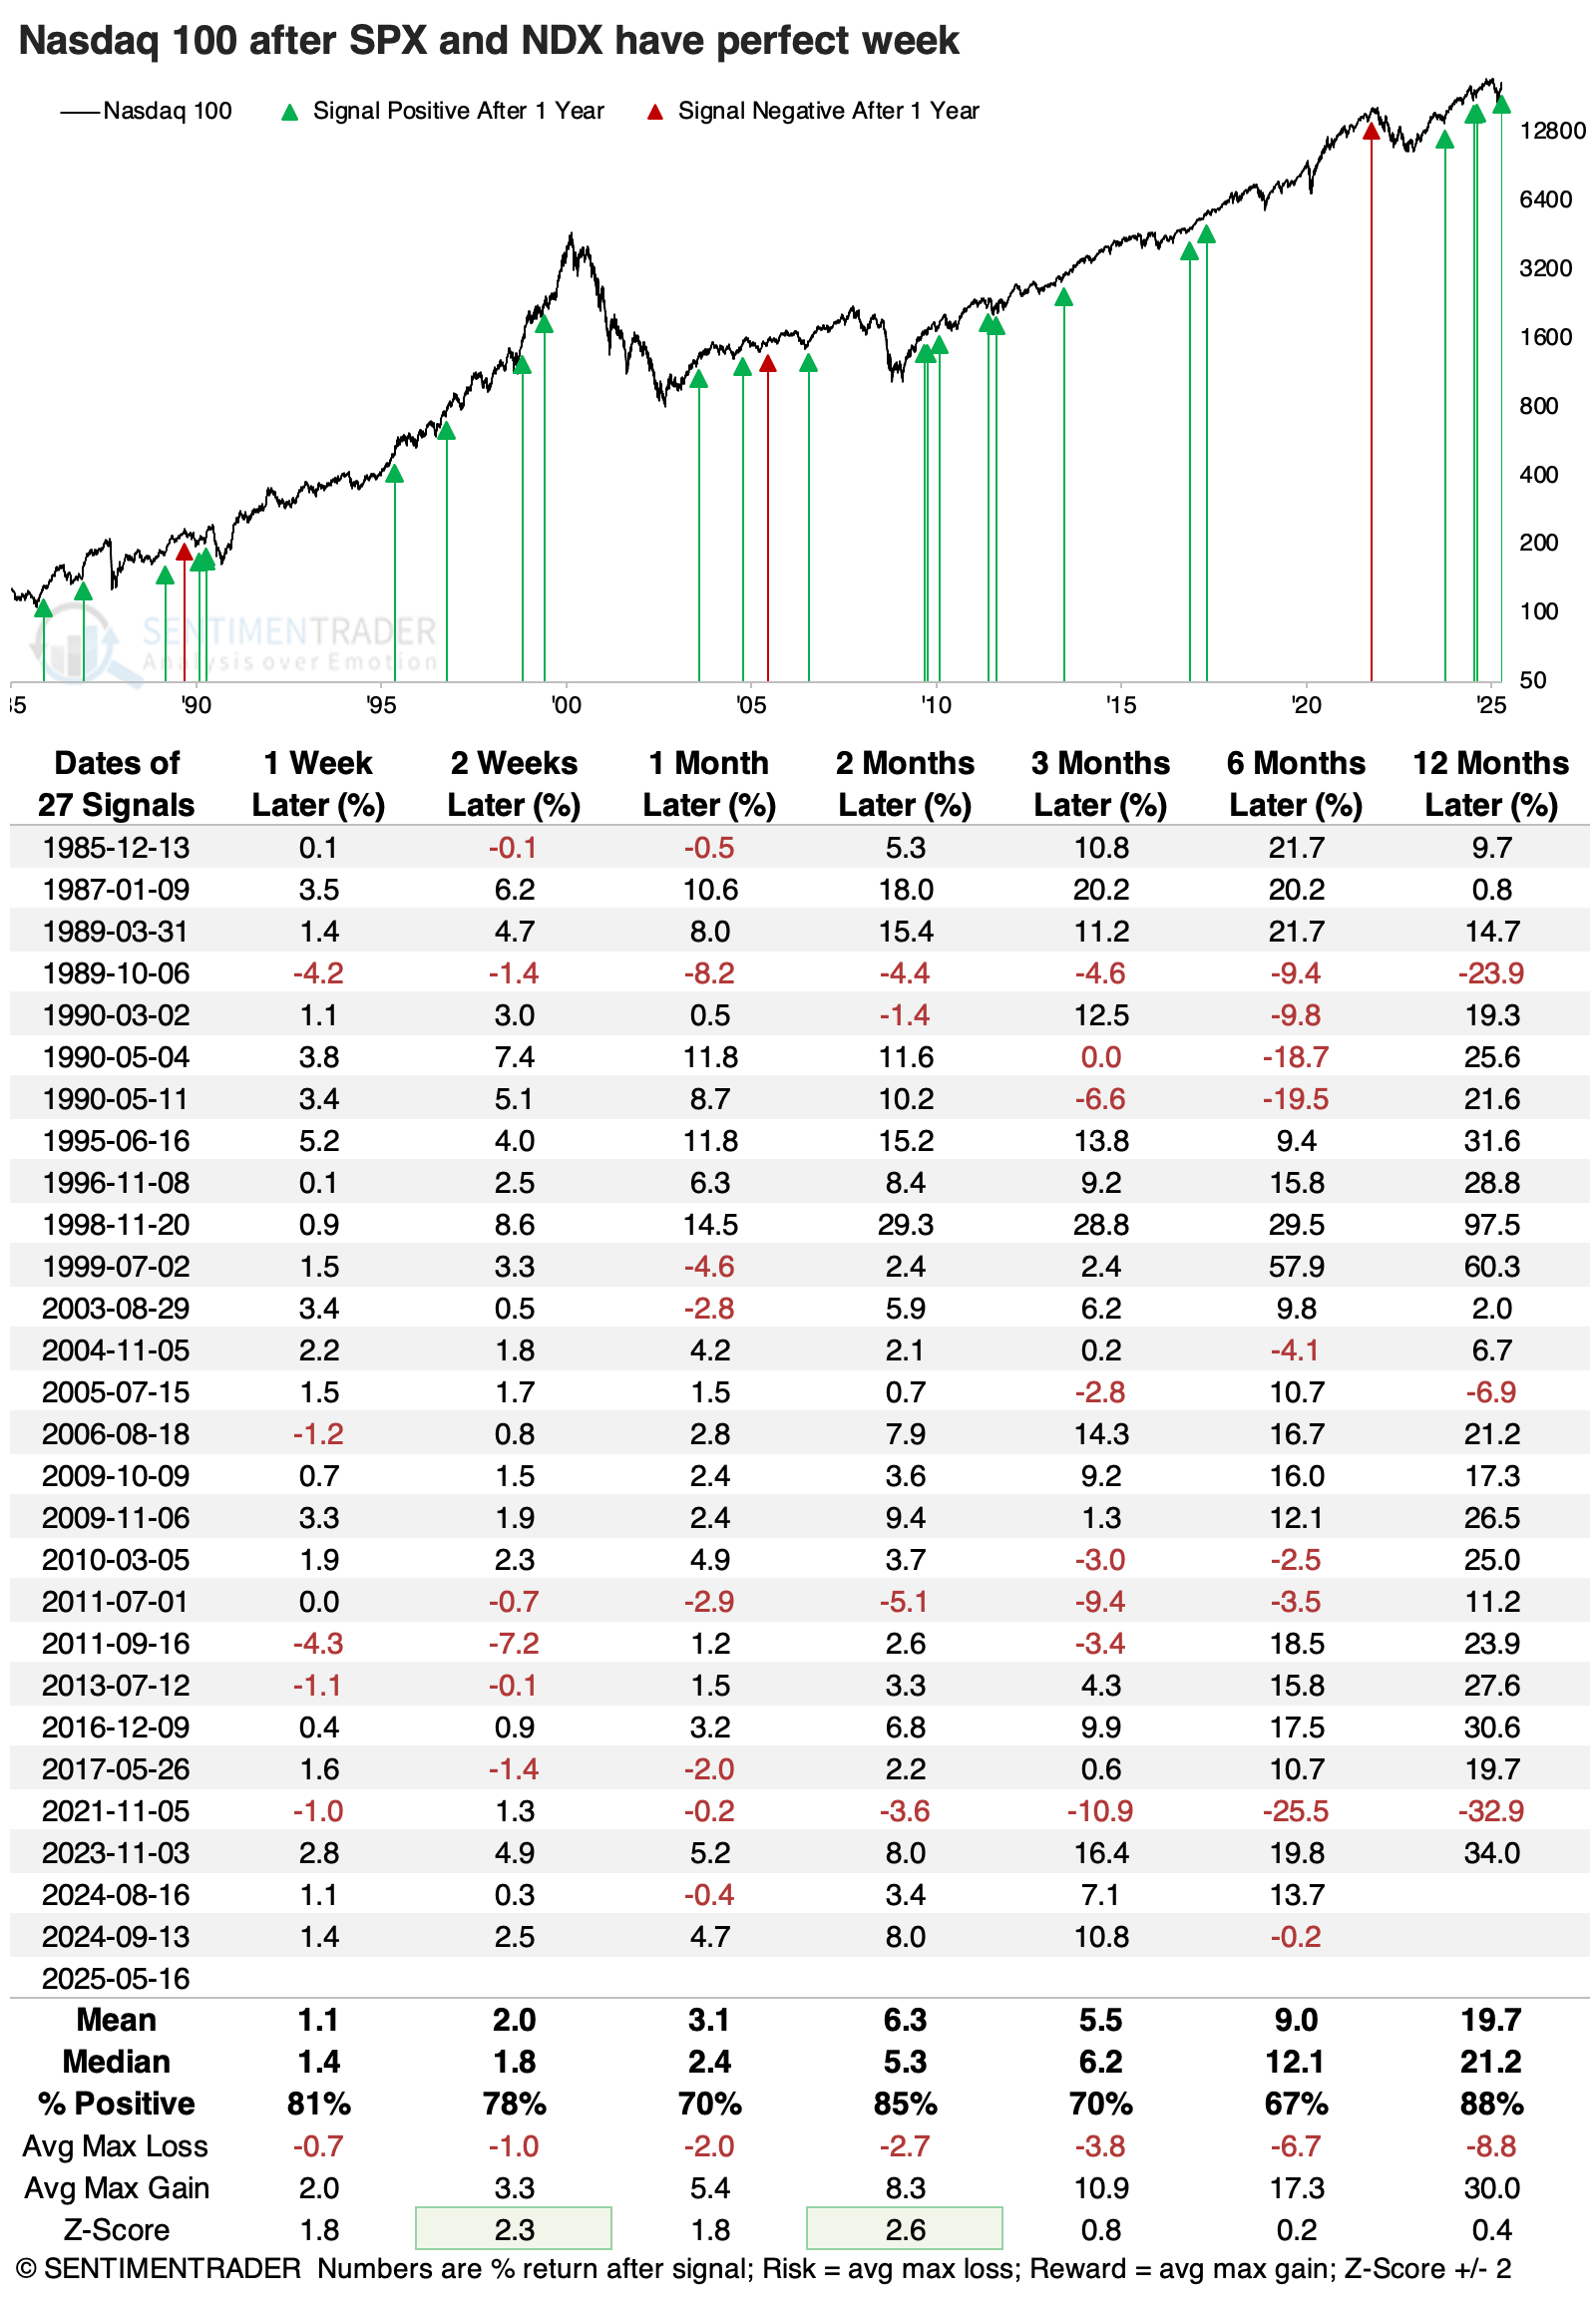
Not just perfect, but really perfect
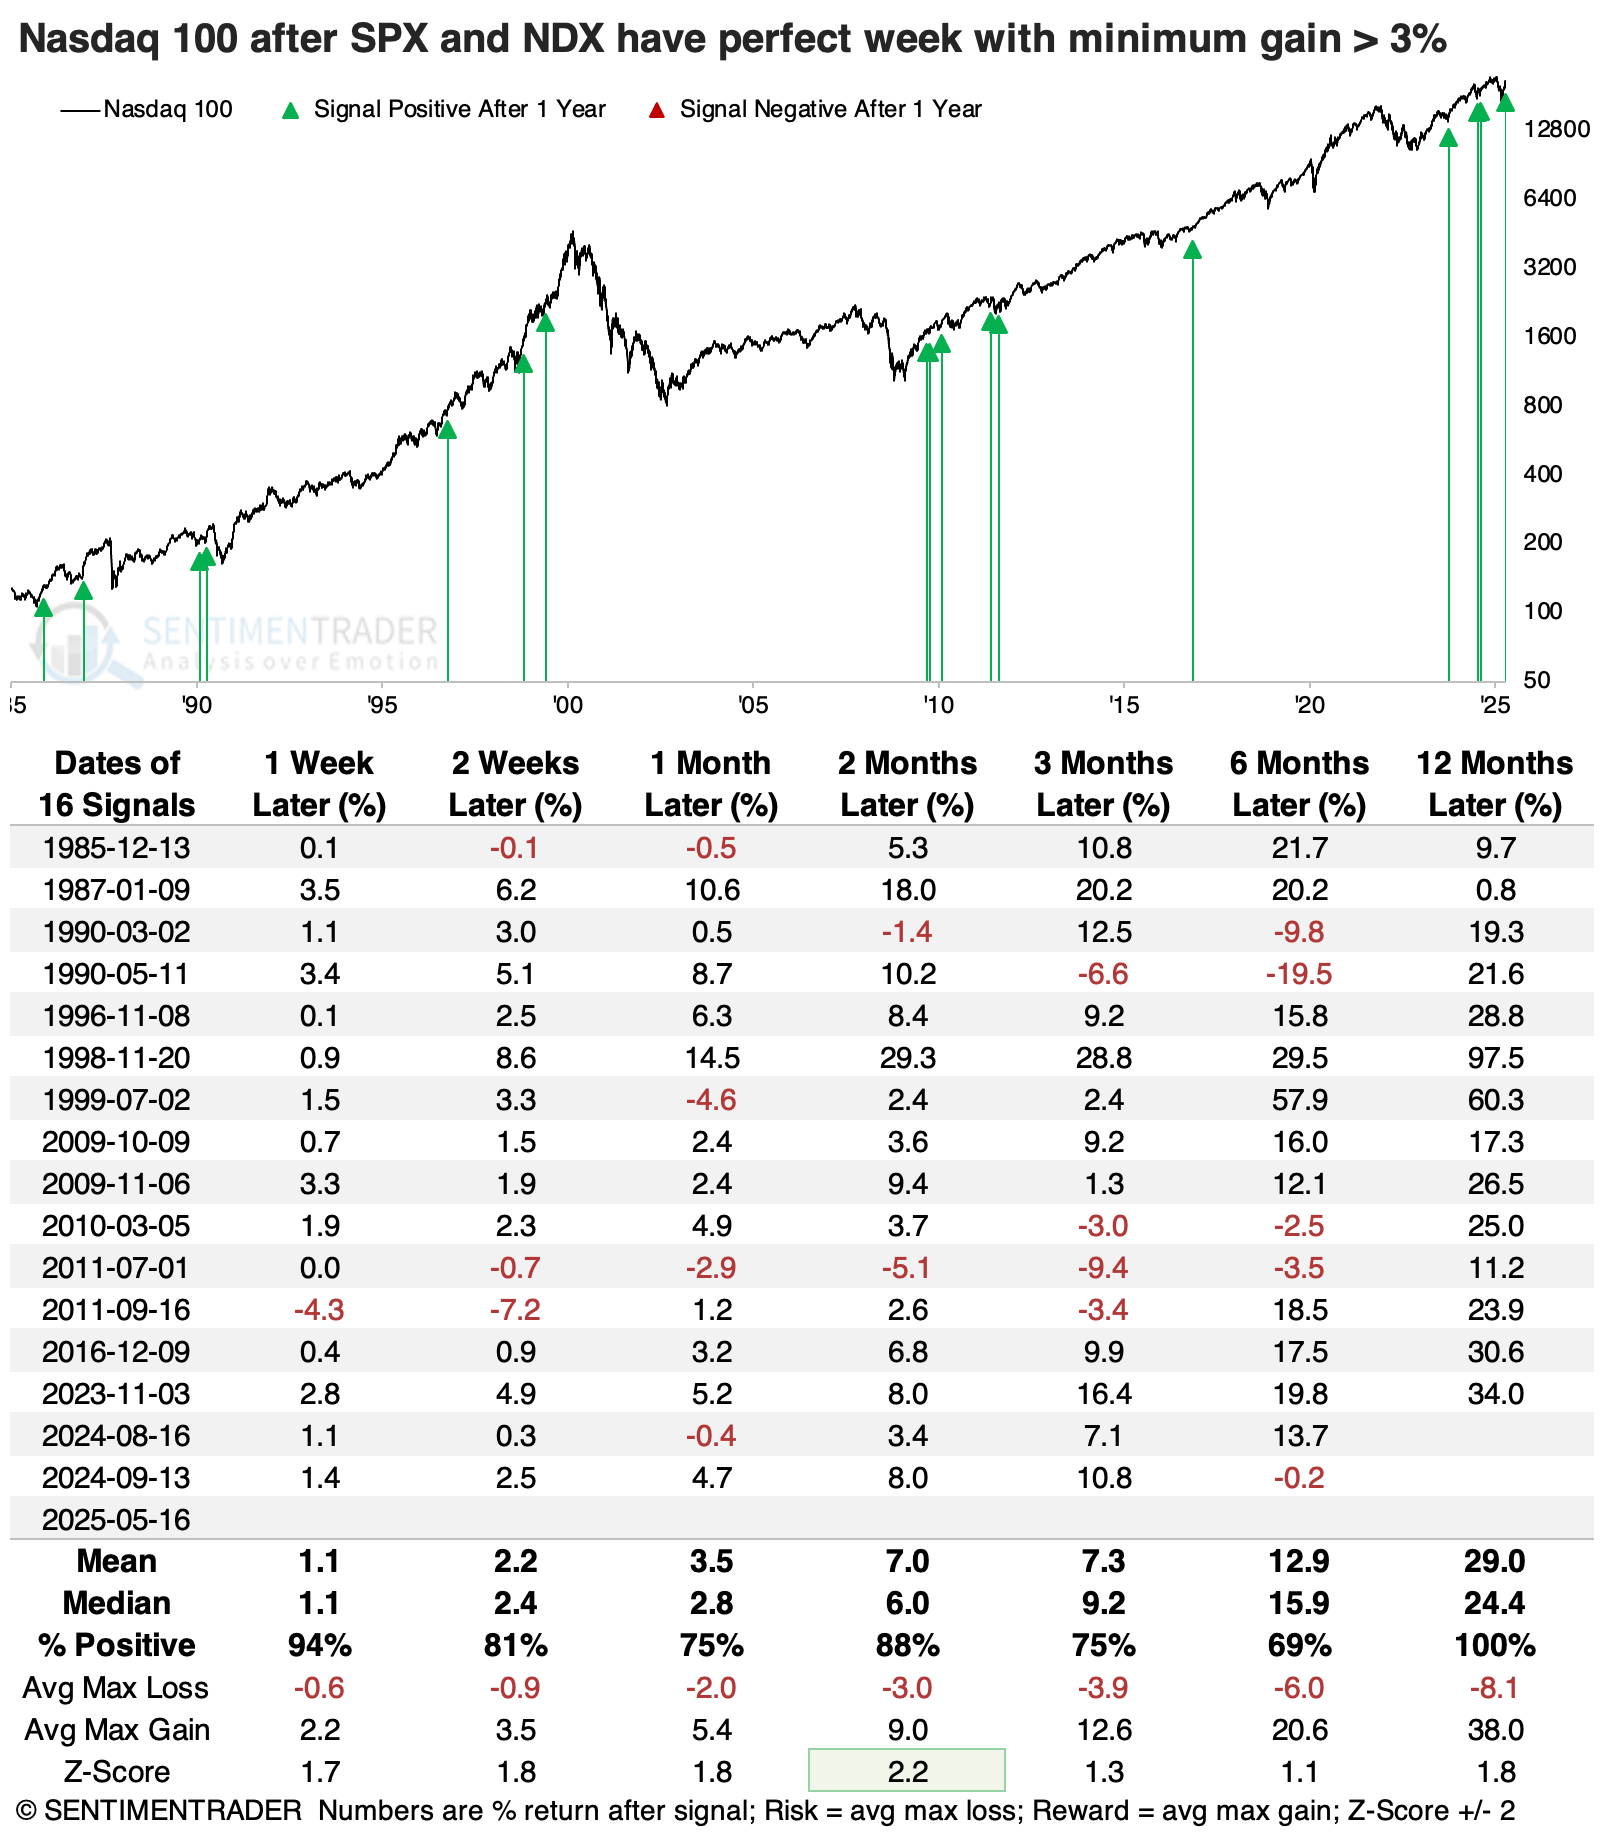
What's even more notable about the perfect weeks is their magnitude. Both indices gained at least 3%, which puts them into rarified air. Perfect weeks with significant gains tended to precede even larger average returns in the S&P 500. Over the following year, it suffered more than a -10% drawdown six times and gained more than +10% twelve times.
Again, the Nasdaq 100 fared even better. The index rallied every time a year after these dual perfect weeks, with an excellent risk/reward profile. It suffered more than a -10% drawdown four times (and only once in the past 30 years), while rising at least +10% fourteen times.
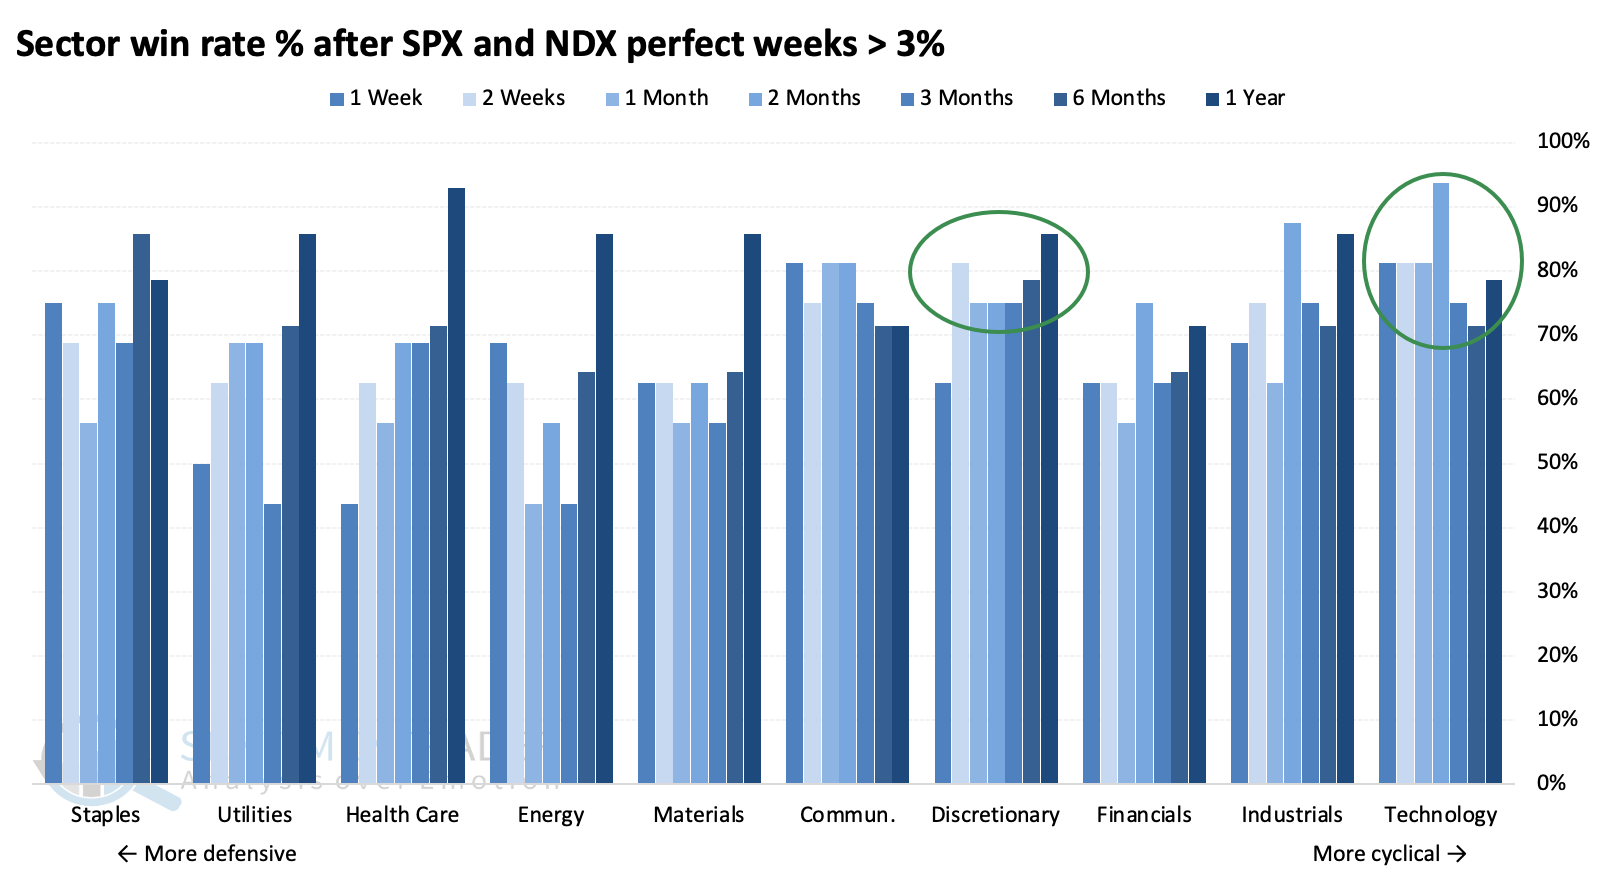
Ever since the historic spike in volatility in early April, average sector returns have tilted toward more aggressive cyclical sectors. This study confirms that dual perfect weeks favored returns in the most cyclical sectors. Discretionary and technology stocks enjoyed among the highest returns from three months and beyond.
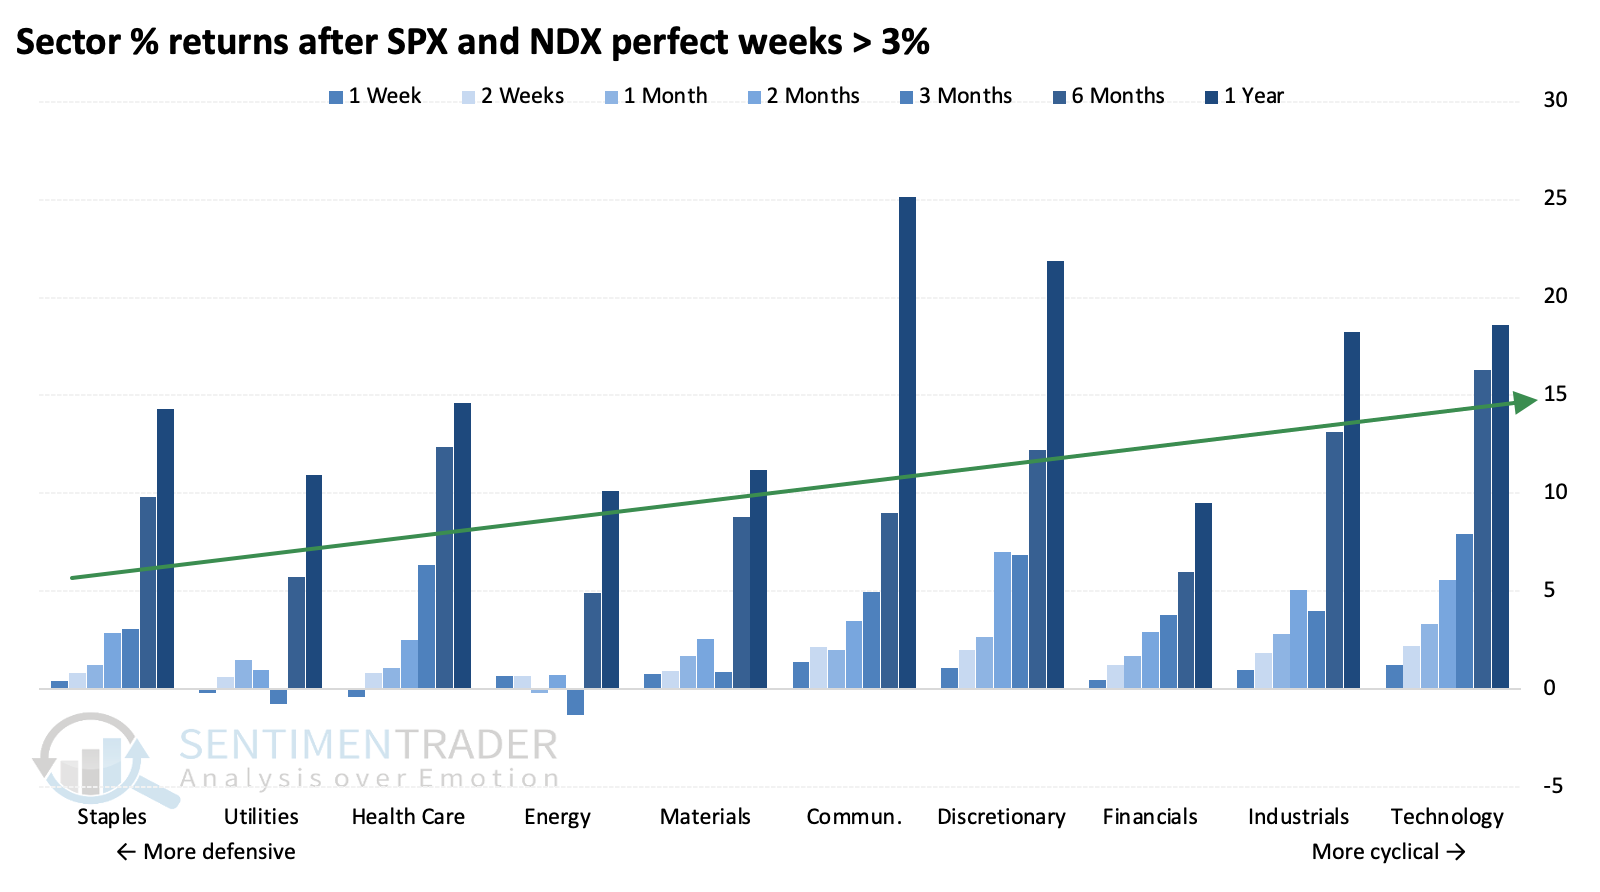
They also enjoyed some of the most consistently high win rates across time frames.
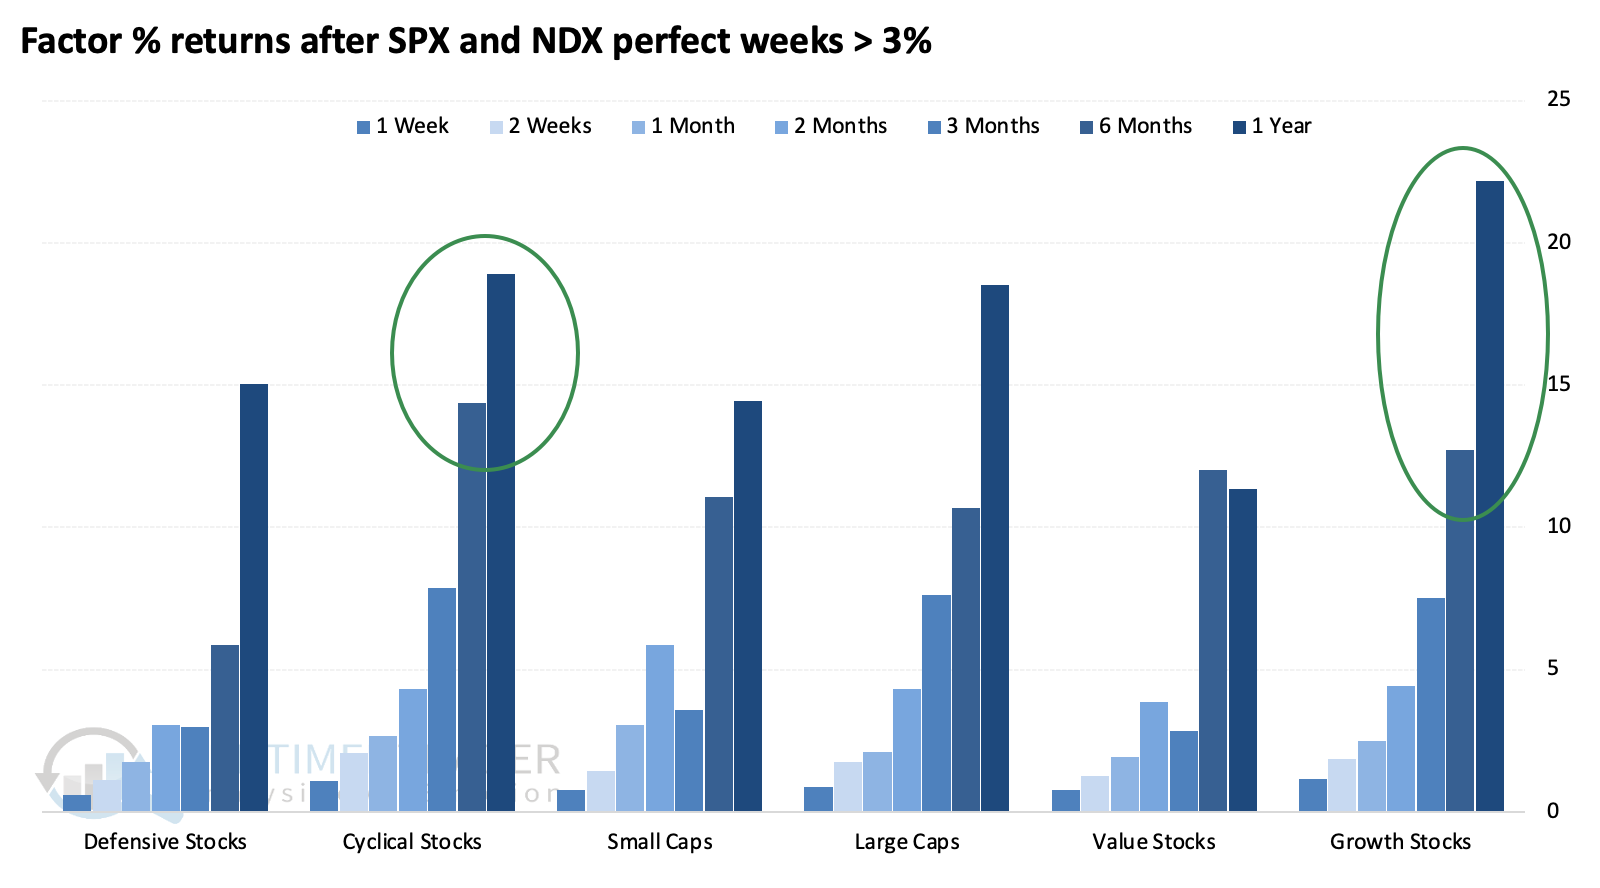
Cyclical and growth stocks enjoyed the highest 6- and 12-month average returns among factors.
What the research tells us...
Investors always freak out when a major ratings agency downgrades a sovereign credit. We've railed against reading too much into ratings downgrades, at least on face value. When the big three agencies downgrade a sovereign, index, or sector (especially if they do so in a cluster), it has proved to be an excellent contrary indicator.
The Moody's U.S. downgrade may throw a temporary wrench into stocks' recent remarkable run, but it shouldn't be too much of a factor behind the short-term - it never has been before. More impressive is buyers' consistent willingness to bid prices higher even in the face of increasingly overbought readings. This behavior does not tend to occur during ongoing bear markets, decreasing the probability we're witnessing "just a bear market rally." So much of what we've discussed over the past month+ has argued against that idea, and the dual perfect weeks by the S&P 500 and Nasdaq 100 further that argument.