Percentage of Members Outperforming the S&P 500 Index
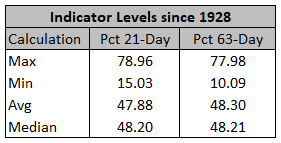
The percentage of members outperforming the S&P 500 Index is an excellent indicator for monitoring market participation. Last week, I featured the series in two notes. The first note highlighted the massive gyrations in the percentage of members outperforming the Index since the pandemic lows. The second note discussed how I use the percentage of members in the traditionally defensive sectors to identify a risk-off environment. I want to share how I use all S&P 500 members outperforming the Index to identify risk-off signals in today's note.
As the famed investment strategist Bob Farrell once said, "Markets are strongest when they are broad and weakest when they narrow to a handful of issues."
Percentage of Members Outperforming the Index Risk-Off Components
- Percentage of S&P 500 members outperforming the Index on a rolling 21-day basis
- Percentage of S&P 500 members outperforming the Index on a rolling 63-day basis

Percentage of Members Outperforming the Index Risk-Off Conditions
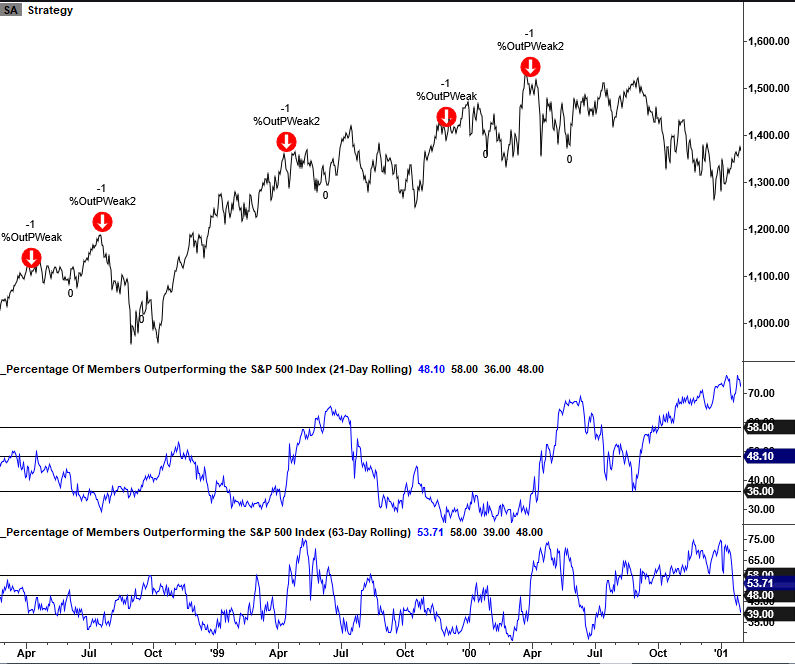
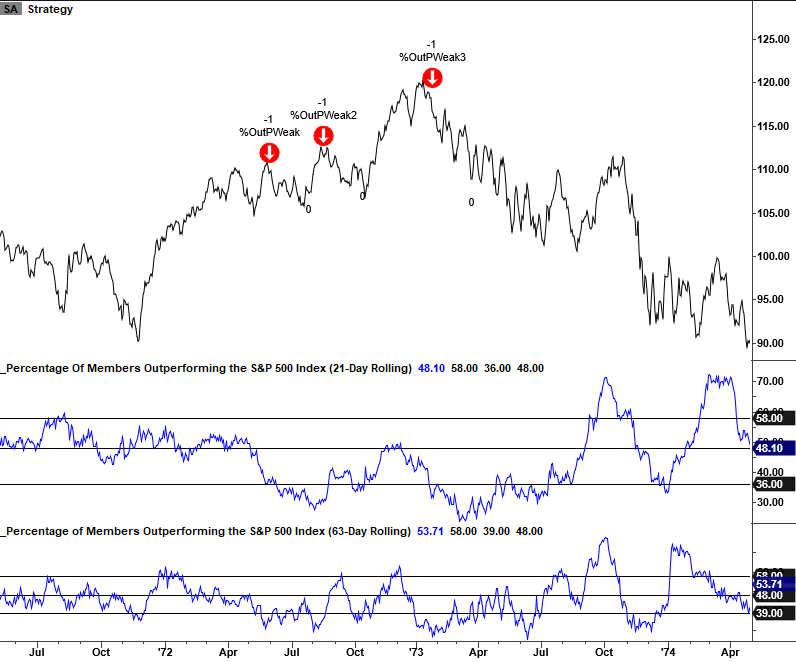
The percentage of members outperforming the S&P 500 Index risk-off signal seeks to identify instances in history when very few members participate as the S&P 500 Index hovers near a high. The model will issue four separate alerts based upon the following conditions.
Signal 1
Condition1 = Percentage outperforming rolling 21-day <= 22nd percentile
Condition2 = Percentage outperforming rolling 63-day <= 22nd percentile
Condition3 = S&P 500 Index is 1.0% or less below a 252-day high
Condition4 = If Condition 1, 2, & 3, start a days since true count
Condition5 = If days since true count <= ten days and the S&P 500 crosses below a price range rank threshold level, signal risk-off.
Signal 2
Condition1 = Percentage outperforming rolling 21-day <= 3rd percentile
Condition2 = Percentage outperforming rolling 63-day <= 3rd percentile
Condition3 = S&P 500 Index is 1.0% or less below a 252-day high
Condition4 = If Condition 1, 2, & 3, start a days since true count
Condition5 = If days since true count <= ten days and the S&P 500 crosses below a price range rank threshold level, signal risk-off.
Signal 3
Condition1 = Percentage outperforming rolling 21-day <= 1st percentile
Condition2 = S&P 500 Index is 3.0% or less below a 252-day high
Condition3 = If Condition 1, 2, and the 5-day rate of change for the S&P 500 is below a user-defined threshold, signal risk-off.
Signal 4
Condition1 = Percentage outperforming rolling 63-day < 1st percentile
Condition2 = S&P 500 Index is 3.0% or less below a 252-day high
Condition3 = If Condition 1, 2, and the 5-day rate of change for the S&P 500 is below a user-defined threshold, signal risk-off.
Note: The percentile value in the model conditions is a ranking of all instances since 1928. 100% = highest ranking.
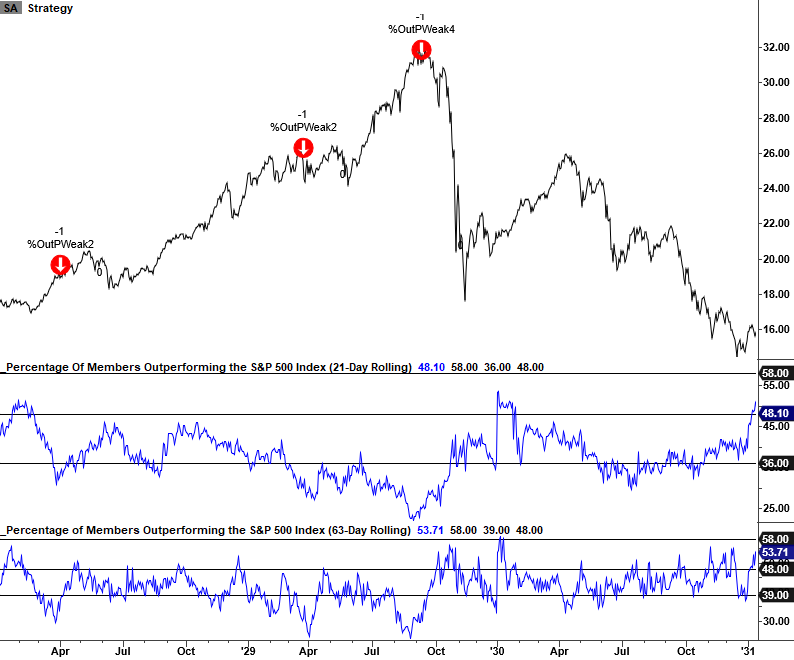
Let's take a look at the current day conditions and some historical signal examples.
Current Day Chart Example
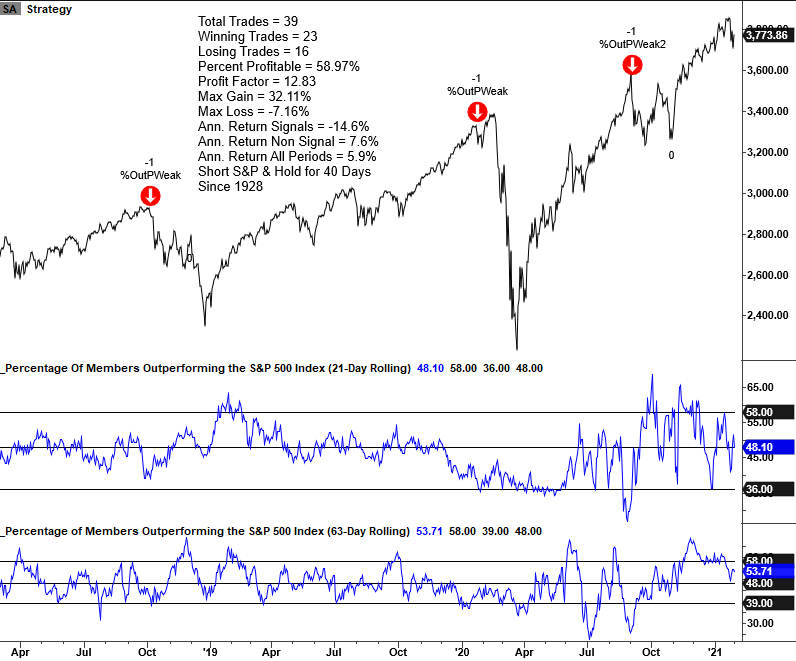
As the chart below shows, current indicator readings for both series are above the long-term averages and nowhere near the levels associated with a risk-off signal. However, the indicators have made a series of lower highs as the market advanced over the last three months. I will be monitoring participation levels for this model on any new high in the S&P 500. Please note, I calculated performance statistics in the chart as a short signal, whereas annualized returns result from buying the S&P 500.
1998-2000 Example
1972-74 Example
1929-30 Example
Signal Performance
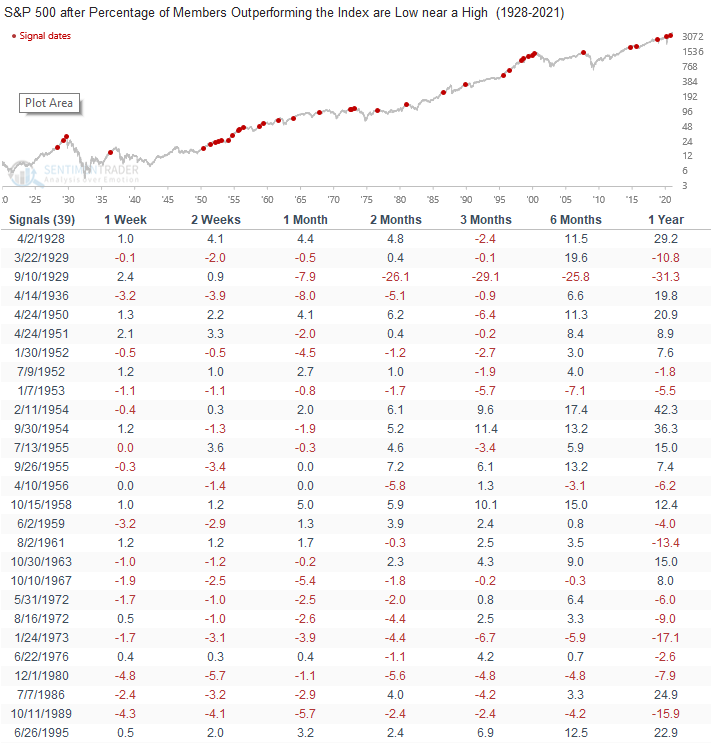
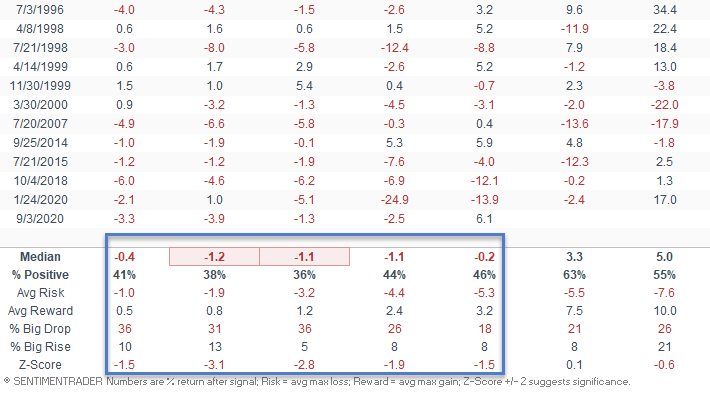
As the table below shows, S&P 500 performance is consistently weak across the board in the 1-12 week timeframe.
Conclusion: Based on each series current levels, it's unlikely that a risk-off signal will trigger in the short-term. I will be monitoring this model along with several other ones that I have shared in recent notes as the market approaches new highs.

