
Paying close attention to copper

Key points
- Copper topped out in May 2024 and is now 20% off its high, below a long-term moving average and testing critical support
- Meanwhile, the Copper/Gold Ratio continues to argue for a higher price in the year ahead
- Likewise, a seasonal tailwind might help copper between now and late February 2025
- A copper ETF offers a lower-risk alternative to copper futures
Copper has plunged to test a critical level
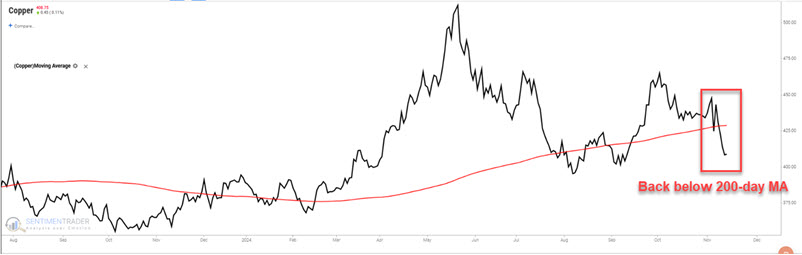
On a trend-following basis, there is presently little reason to tout a bullish stance towards copper. The chart below shows the run-up into May 2024 and the decline since. Price recently plunged back below the 200-day moving average. Generally speaking, it can be very dangerous to buy into this type of decline.
The chart below "zooms out" to consider the bigger picture, using a weekly chart of copper.
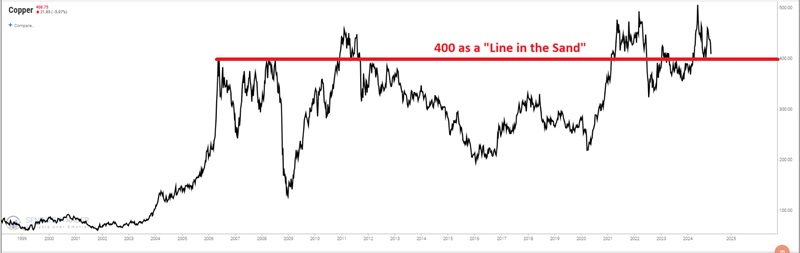
The critical thing to note is the "support/resistance" level at 400. Historically, copper has not spent much time trading above that price level. A trader willing to consider the long side of copper (more on that subject in a moment) needs to keep a close eye on this critical price level. If support at 400 is broken, history suggests some significant downside could follow. However, as long as copper holds above 400, there remains potential for an upside reversal. Let's look more closely at this possibility.
The Copper/Gold Ratio remains bullish for copper
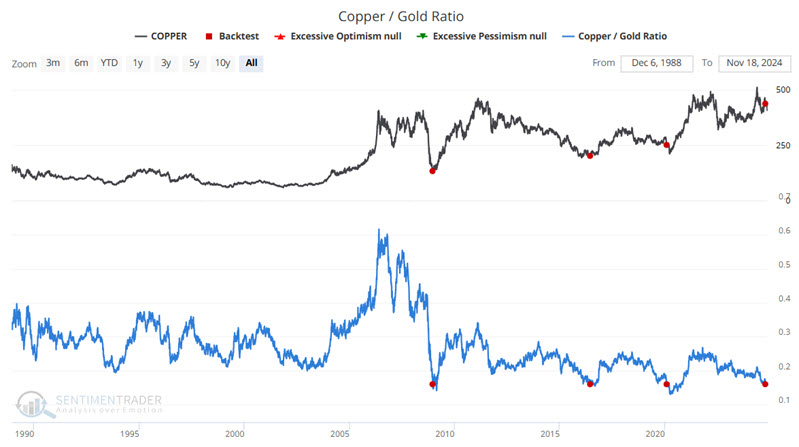
As the name implies, the Copper/Gold Ratio compares the price of copper futures to the price of gold futures to essentially measure the relationship between the foremost industrial and precious metals. At this time, copper is historically cheap compared to gold.
The chart below highlights all dates when the Copper/Gold Ratio was below 0.16, and the table highlights subsequent copper performance.
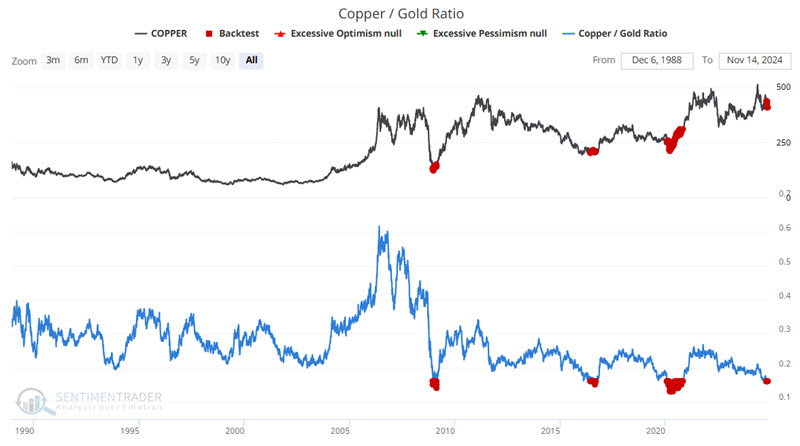
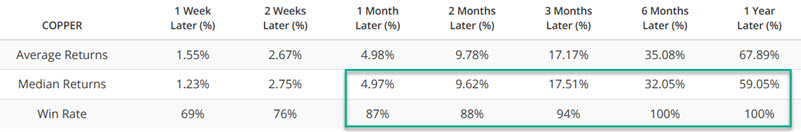
Historical results are pretty eye-popping. However, there were only three previous periods when the ratio fell this low, so the small sample size is definitely a concern. To illustrate, the chart below highlights only those dates when the Copper/Gold Ratio crossed below 0.16 for the first time in a year.
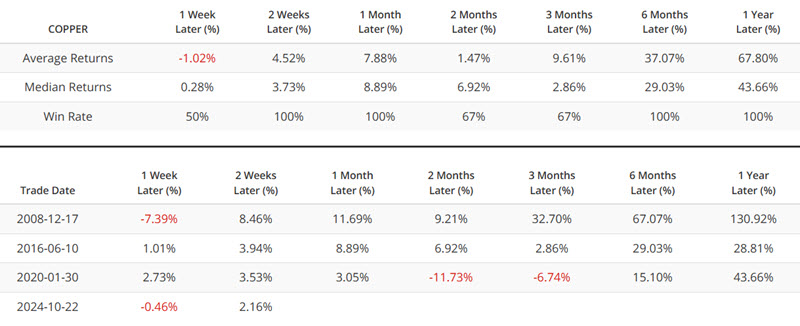
The minuscule sample size warns us not to be mesmerized by "historical results." Likewise, it is fair to note that copper has declined almost 7% since the supposedly "bullish" signal on 2024-10-22. With those caveats and warnings in place, the overall results still suggest that this bears watching and that traders might give the bullish case the benefit of the doubt IF copper:
- Holds above 400
- Reverses back above the 200-day MA
A potentially favorable seasonal tailwind
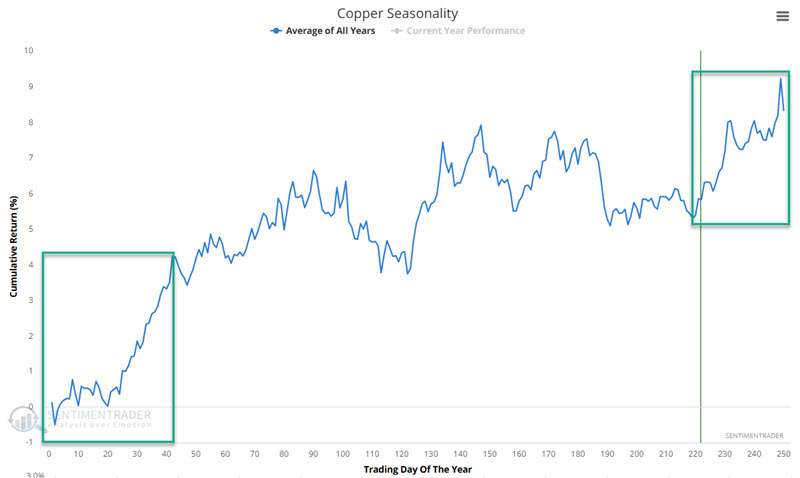
The chart below displays the annual seasonal trend for copper futures. The current period between Trading Day of Year #219 and Trading Day of Year #42 next year is highlighted in green. This period began at the close on 2024-11-11. It should be noted that copper futures have lost $3,500 in value since then (a reminder that seasonality is not a roadmap).
The chart below displays the cumulative $ gain/loss from holding a long position in copper futures only during this period since 1960.
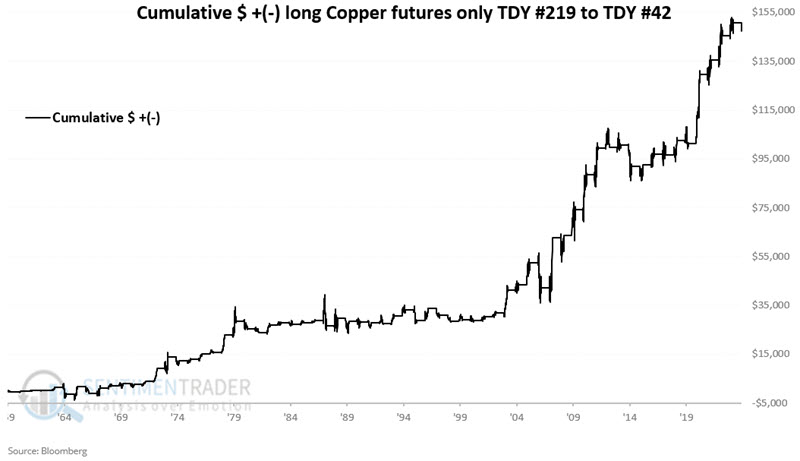
The table below summarizes copper futures' performance during this period.
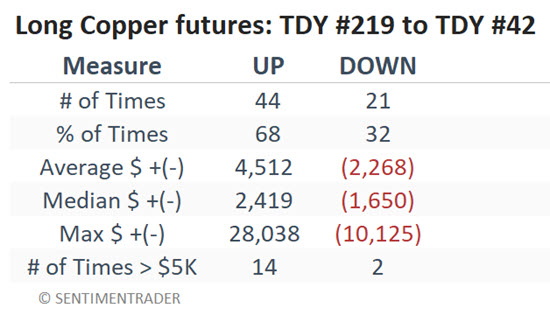
A 68% Win Rate suggests this factor should not be relied upon as a standalone indicator. However, when combined with a more meaningful signal - such as the one from the Copper/Gold Ratio - and if confirmed by an upside reversal in price, this seasonal trend can add significant weight to the bullish side of the ledger. Large moves over $5,000 have historically skewed 14 to 2 to the winning side.
Alternatives to Copper futures
Most investors and traders will never trade copper futures due to the leverage and volatility involved. That does not mean they cannot gain exposure to copper as an asset class. The United States Copper Index Fund, LP (ticker CPER) is an ETF that invests in copper futures contracts. The ETF's objective is to reflect the return of an index benchmark for copper futures minus its expenses. The ETF's holdings include copper futures contracts and an equal amount of cash and equivalents serving as collateral. In essence, investors can buy access to the price movements of copper just as they would by buying shares of stocks.
What the research tells us…
The research tells us that now is a time for investors willing to speculate in metals to keep a close eye on the copper market. The signals from the Copper/Gold Ratio and Copper Seasonality suggest a potentially favorable trend in the months ahead. But as always, there are no guarantees on each particular roll of the dice. Likewise, it is typically wise to wait for some "signs of life" before taking the plunge rather than buying into the teeth of a decline. Investors should also carefully consider the best trading vehicle (futures or ETFs), how much capital to commit, and how much to risk.