
Participation among cyclical sector stocks dwindles

Key points:
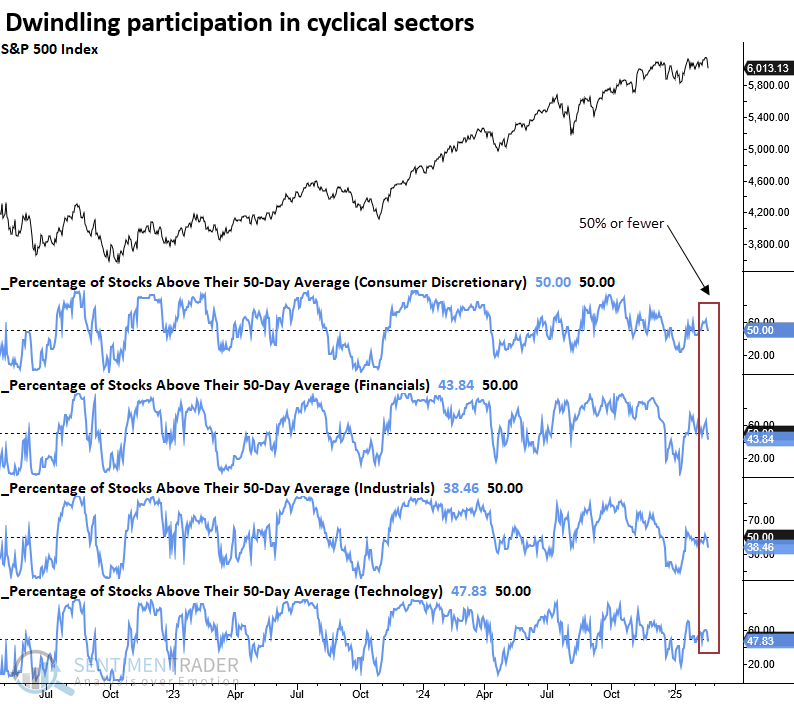
- Less than half of the stocks in four cyclical sectors are trading above their 50-day moving average
- Similar breadth profiles suggest the S&P 500 could experience a lackluster outlook over a medium-term horizon
- Two components in the Risk-Off Composite Model triggered alerts
Does a narrowing in participation from cyclical sector stocks warrant caution?
As I highlighted in a recent research report, the S&P 500 has been range-bound for several months. These periods of consolidation allow moving averages to catch up to price. Consequently, breadth-based indicators that track short- to medium-term trends, such as the percentage of stocks above their 50-day moving average, often show weakening participation. This pattern has played out in recent months and was intensified by the end-of-week selloff.
On Friday, 50% or fewer of stocks in the S&P 500 consumer discretionary, financials, industrials, and technology sectors closed above their 50-day averages, with the world's most benchmarked index only two days removed from an all-time high. This scenario has never occurred.
In a December 2024 report, I noted a participation problem driven by defensive and commodity-oriented sectors- a phenomenon I wasn't concerned about because cyclical sectors displayed favorable trends. However, that's not the case now, as the narrowing breadth backdrop has shifted to the four most critical cyclical sectors, demanding my full attention.
Similar participation problems for cyclical sector stocks preceded a lackluster outlook
Whenever 60% or fewer of S&P 500 stocks in the consumer discretionary, financial, industrial, and technology sectors closed above their 50-day averages, the world's most benchmarked index displayed a lackluster outlook over the following six months. Several instances slightly preceded or coincided with significant market tops, with the most recent one occurring in December 2021.
Investors drawing parallels between the current AI boom and the Dotcom era may find the 1999 analogy intriguing. The S&P 500 stagnated for six months but sustained its long-term uptrend before peaking in the spring of 2000.
Given headline risk from the new administration, persistently high 10-year Treasury yields, consecutive 20% gains in the S&P 500, and elevated valuations, a choppy market environment similar to 1999 could persist.
Edit: The original report outlook table title said 50% when it should have been 60%.
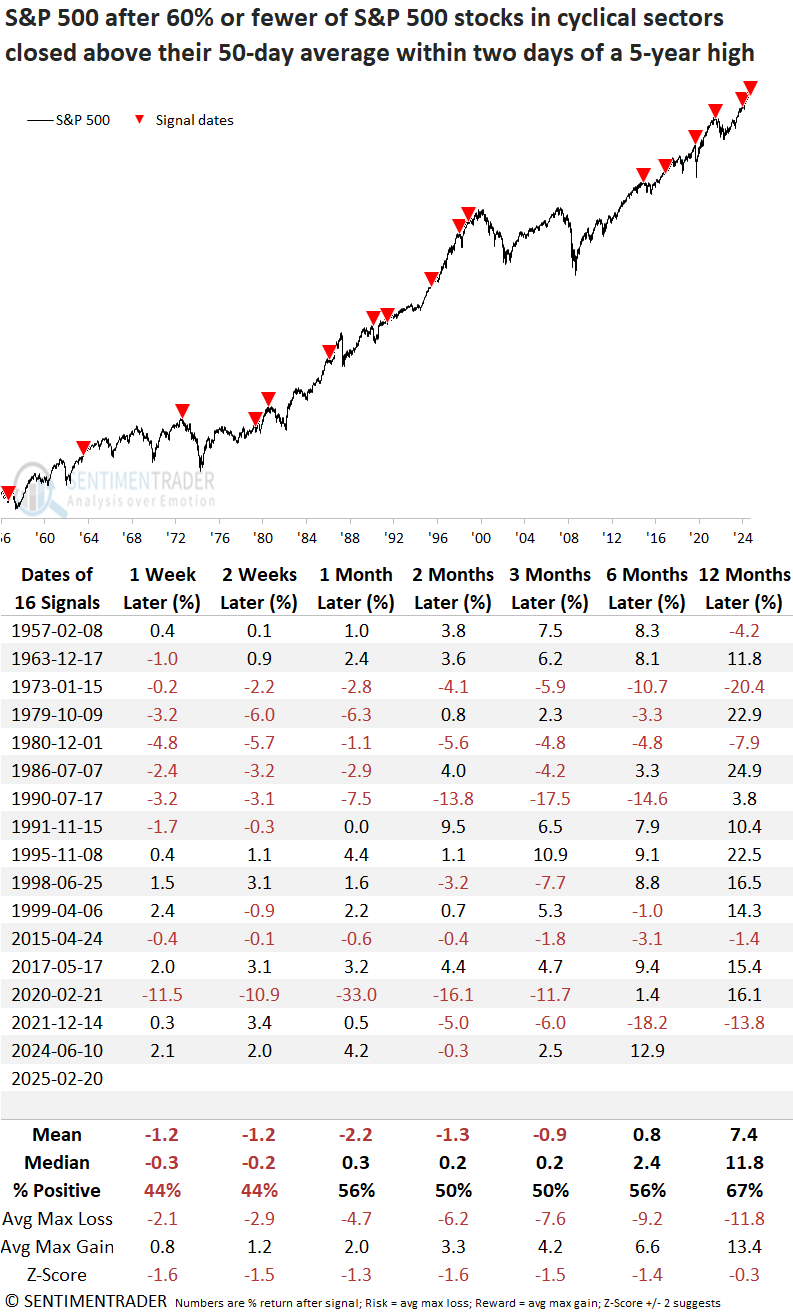
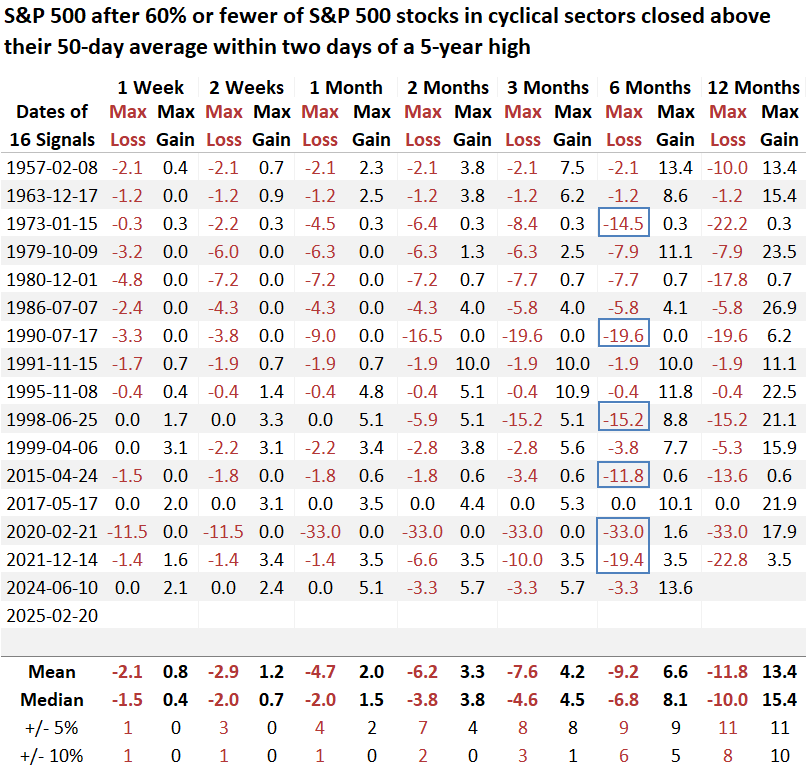
Over the sluggish six-month stretch, the S&P 500 experienced six maximum losses that surpassed -10%, occurring amid significant corrections and bear markets triggered by unfavorable macro conditions.
Rick-Off Composite Model
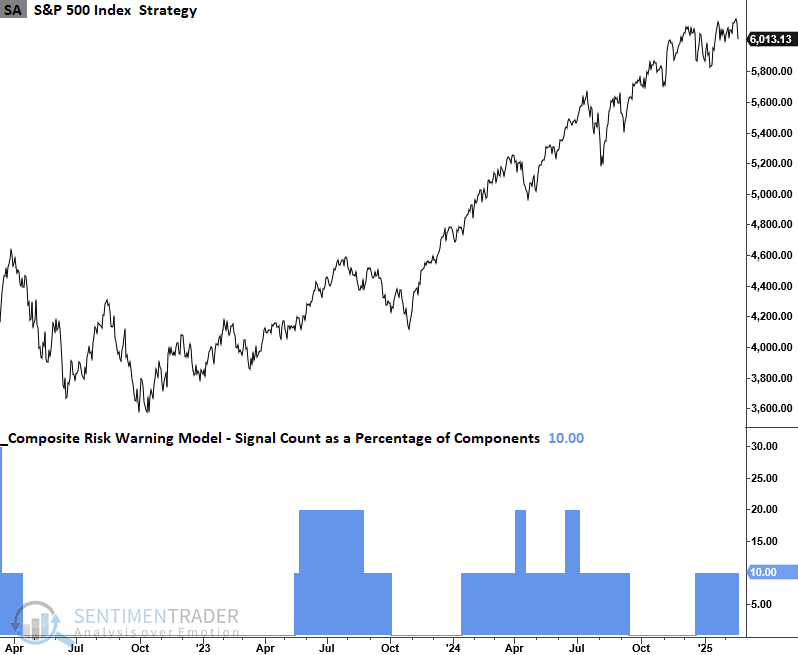
Two components of the Risk-Off Composite Model triggered alerts on Friday, reflecting weak stock participation for S&P 500 stocks. This composite primarily tracks short- to medium-term trends, so these alerts are unsurprising.
The chart below illustrates that breadth-based warnings have occurred more frequently over the past ten months. Since stock indexes have continued to rally, these participation warnings indicate internal churning or sector rotation.
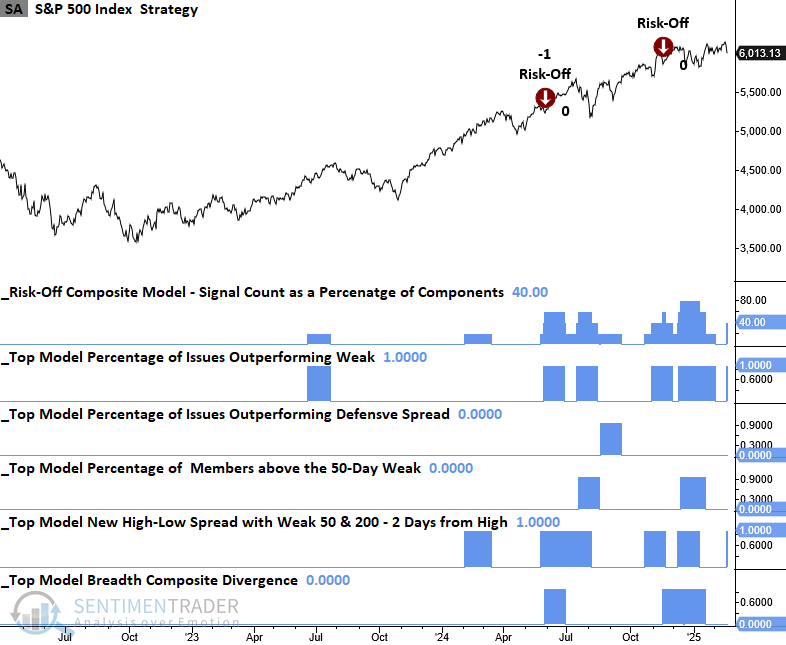
Composite Risk Warning Model
The TCTM Composite Risk Warning Model signal count as a percentage of components currently resides at 10%, suggesting that big-picture market breadth indicators do not confirm the short to medium-term measures.
Several components of the TCTM Composite Risk Warning Model are on my radar
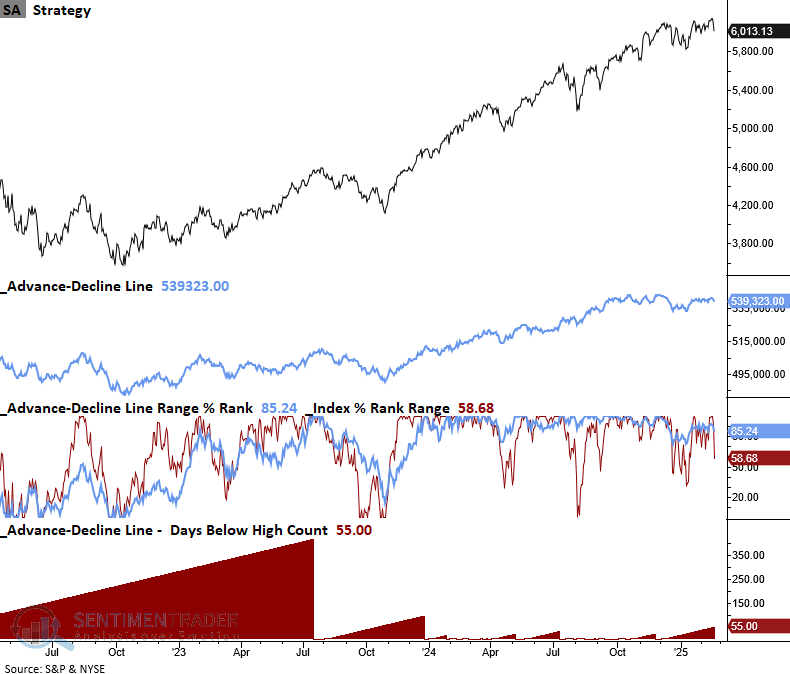
The advance-decline line for NYSE issues has not registered a new high in 55 trading sessions despite the S&P 500 recording a new high. Consequently, this divergence could trigger a signal at some point should this non-confirmation persist. The last alert, triggered in January 2022, provided a timely and accurate warning.
I would also note that the advance-decline divergence model for the S&P 500 and several other indexes displays a divergence.
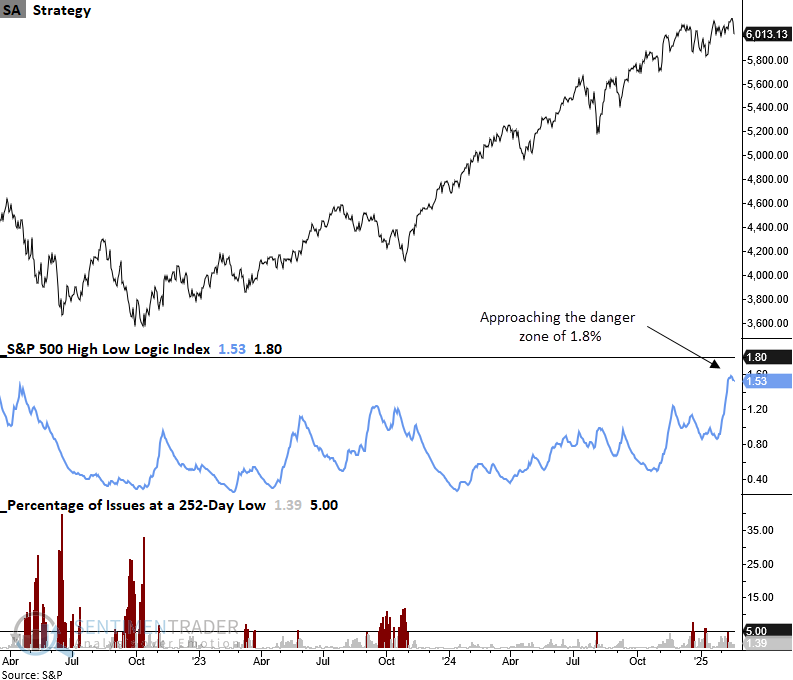
The High-Low Logic Index, a breadth-based indicator created by Norman Fosback that identifies when many stocks register 52-week highs and lows simultaneously, indicating churning, has increased to its highest reading since 2017.
The TCTM Composite Risk Warning Model component, which uses the High-Low Logic Index for S&P 500 stocks, issues an alert when the index exceeds 1.8% and 52-week lows subsequently surge above a threshold.
Other considerations
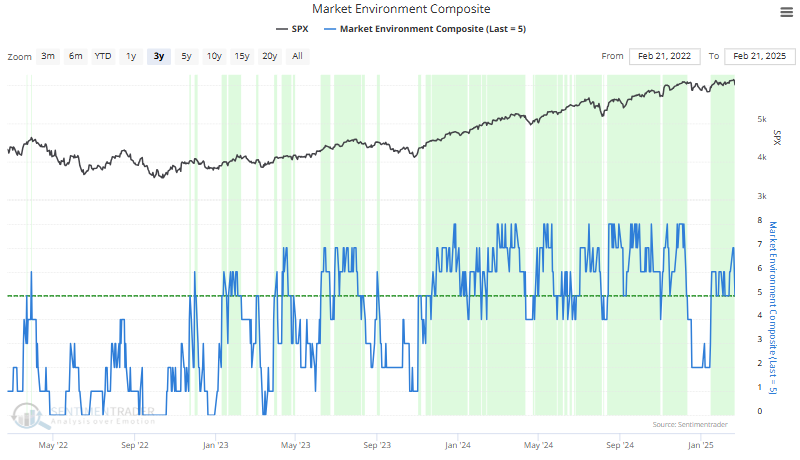
Jason's Market Environment Composite, recently added to the website, saw a two-point drop last Friday. Despite this deterioration, its score of five still reflects a favorable condition.
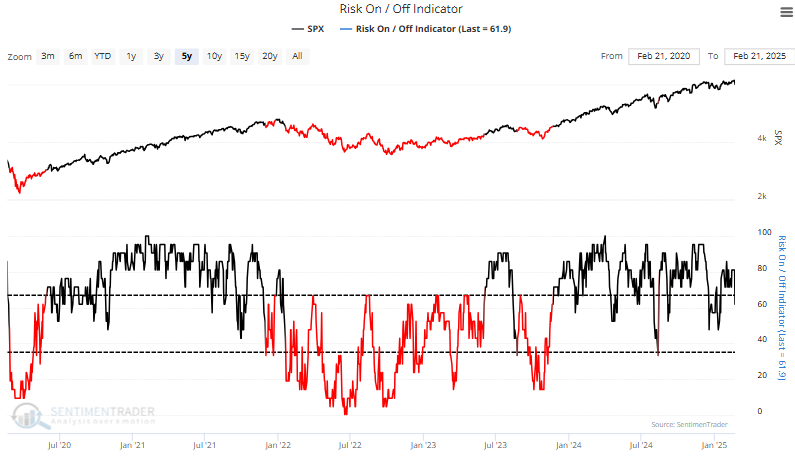
The Risk On/Off Indicator, an additional overlay model that assesses whether the market is healthy or unhealthy, remains in a favorable position.
What the research tells us...
Participation problems are beginning to resurface, which is a common occurrence during extended consolidation phases. However, compared to the last instance when I noted a similar trend, what stands out this time is that the cyclical sectors are driving the decline. Several factors may influence this scenario, including elevated interest rates, policy uncertainty under the new administration, and stretched valuations. Whatever the cause, comparable breadth-based backdrops suggest the S&P 500 could stagnate for six months. For now, the weight of the evidence still leans bullish, but traders should be on guard for further signs of deterioration. Our overlay models, the Risk On/Off Indicator, and the Market Environment Composite are excellent resources for assessing market conditions.