Panic start

It's been a long time since traders faced panic to start a new week. It's always a popular question, so the table below shows every time SPY gapped down 1% or more on a Monday, filtered by times when it was still trading within 5% of a 52-week high. The returns are shown as of the open of the gap down day (i.e. today's opening price).
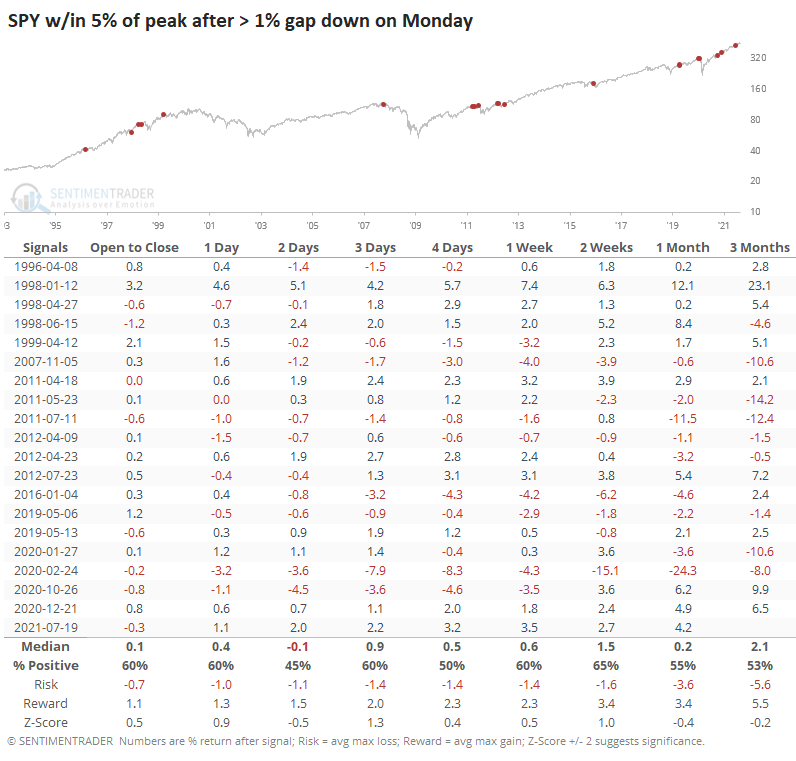
There was a mild tendency to bounce right away, but over the next couple of sessions, often a lower low. Same goes for if we look at time instead of price. The table below shows the same new-week panics, but when SPY was less than 3 weeks removed from its high.
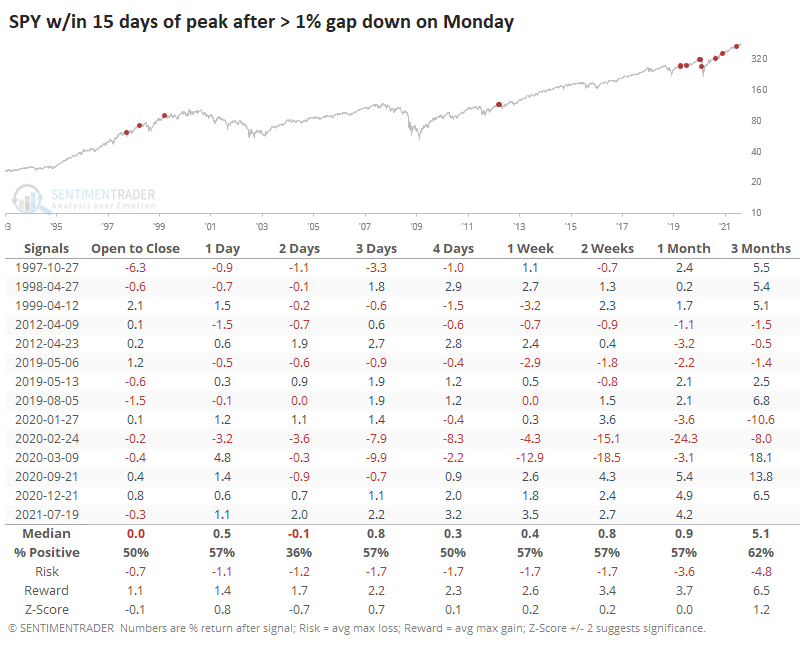
Here, an even larger tendency to see further weakness over the next couple of days.
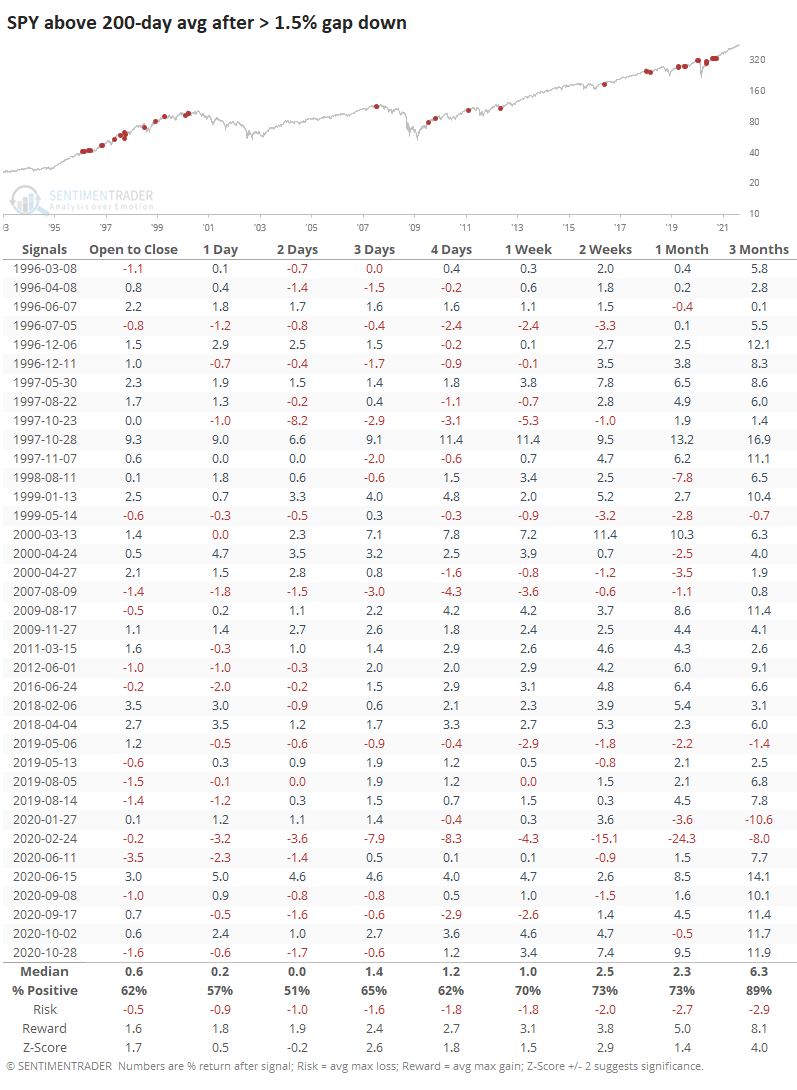
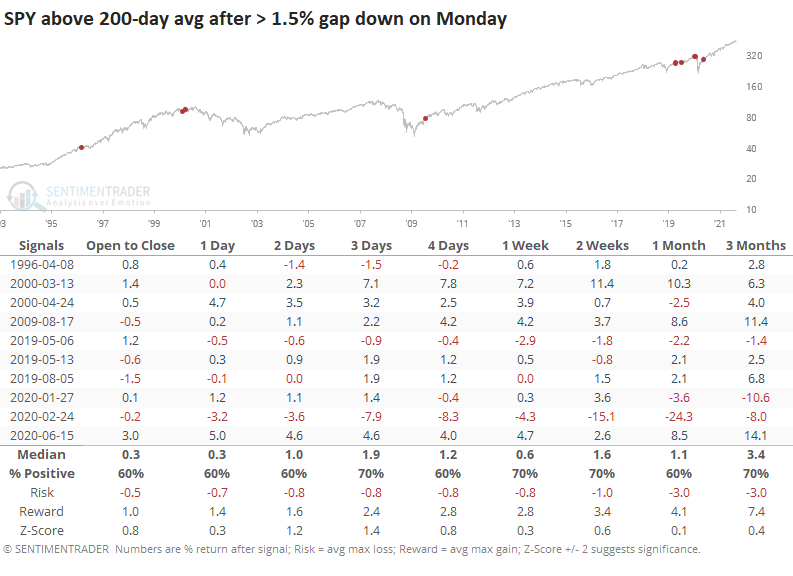
If we look for large gaps down, which it looks like we might get, but loosen the trend to only require that SPY be above its 200-day average, today would count among the largest panics to start a new week.
If we remove the Monday requirement, then big gaps down during an uptrend show a coin-toss over the next couple of sessions but become favorable the longer out we look (of course). By three months later, there were only 4 losers out of a sample of 37, and two of those losses were small.